Run Cell Ranger for 10x dataset
Cell Ranger is the standard bioinformatics pipeline from 10x Genomics used to process raw sequencing data from their single-cell platforms. It handles demultiplexing, alignment, barcode/UMI processing, and cell calling to generate the feature-barcode matrices and preliminary clustering results that are the starting point for all downstream scRNA-seq analysis.
This guide will walk you through the steps to run the Cell Ranger block in Platforma, from configuration to interpreting the standard output reports.
Project Setup
Before beginning, you must have a project with an imported dataset. This block assumes you have already imported your raw .fastq.gz files (as shown in the video).
For this tutorial, we will use a "10x gene expression" dataset containing four samples of multi-lane, paired-end FASTQ files.
Running the Cell Ranger Analysis
Adding the Cell Ranger Block
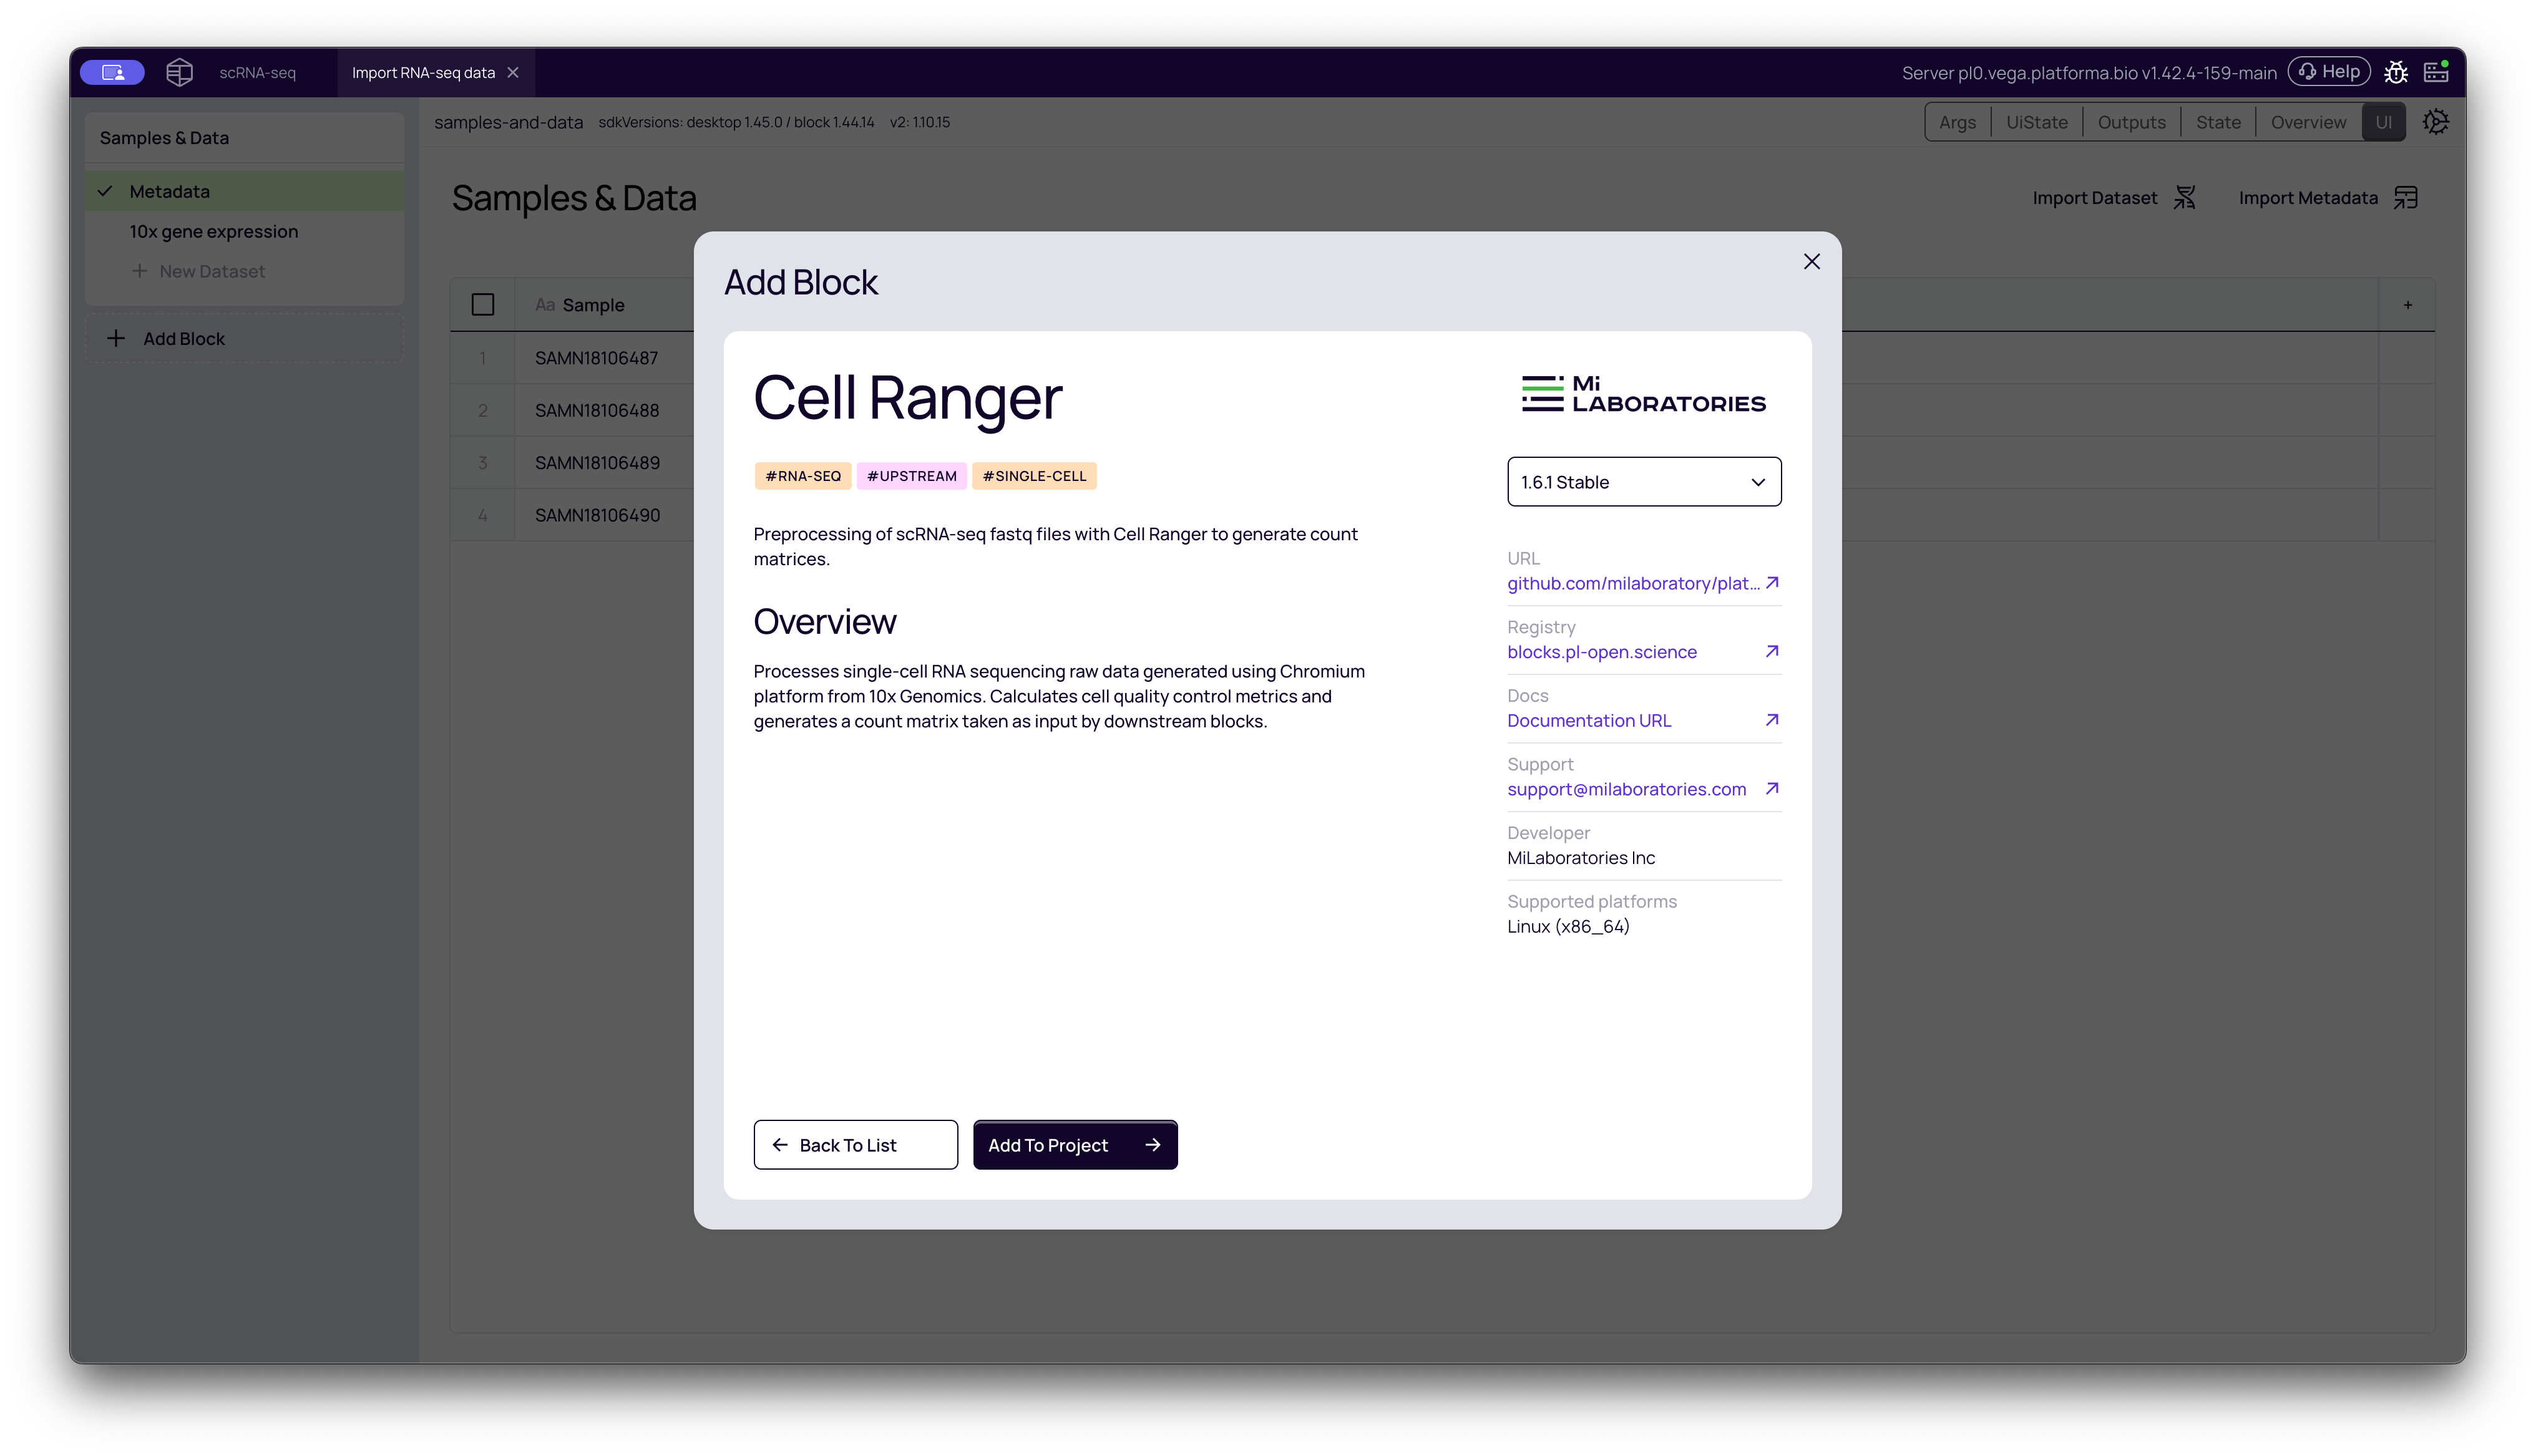
- From your project pipeline, click the Add Block button.
- Use the search bar to find and select the Cell Ranger analysis block.
- Click Add to Project to add it to your analysis pipeline.
Configuring the Analysis
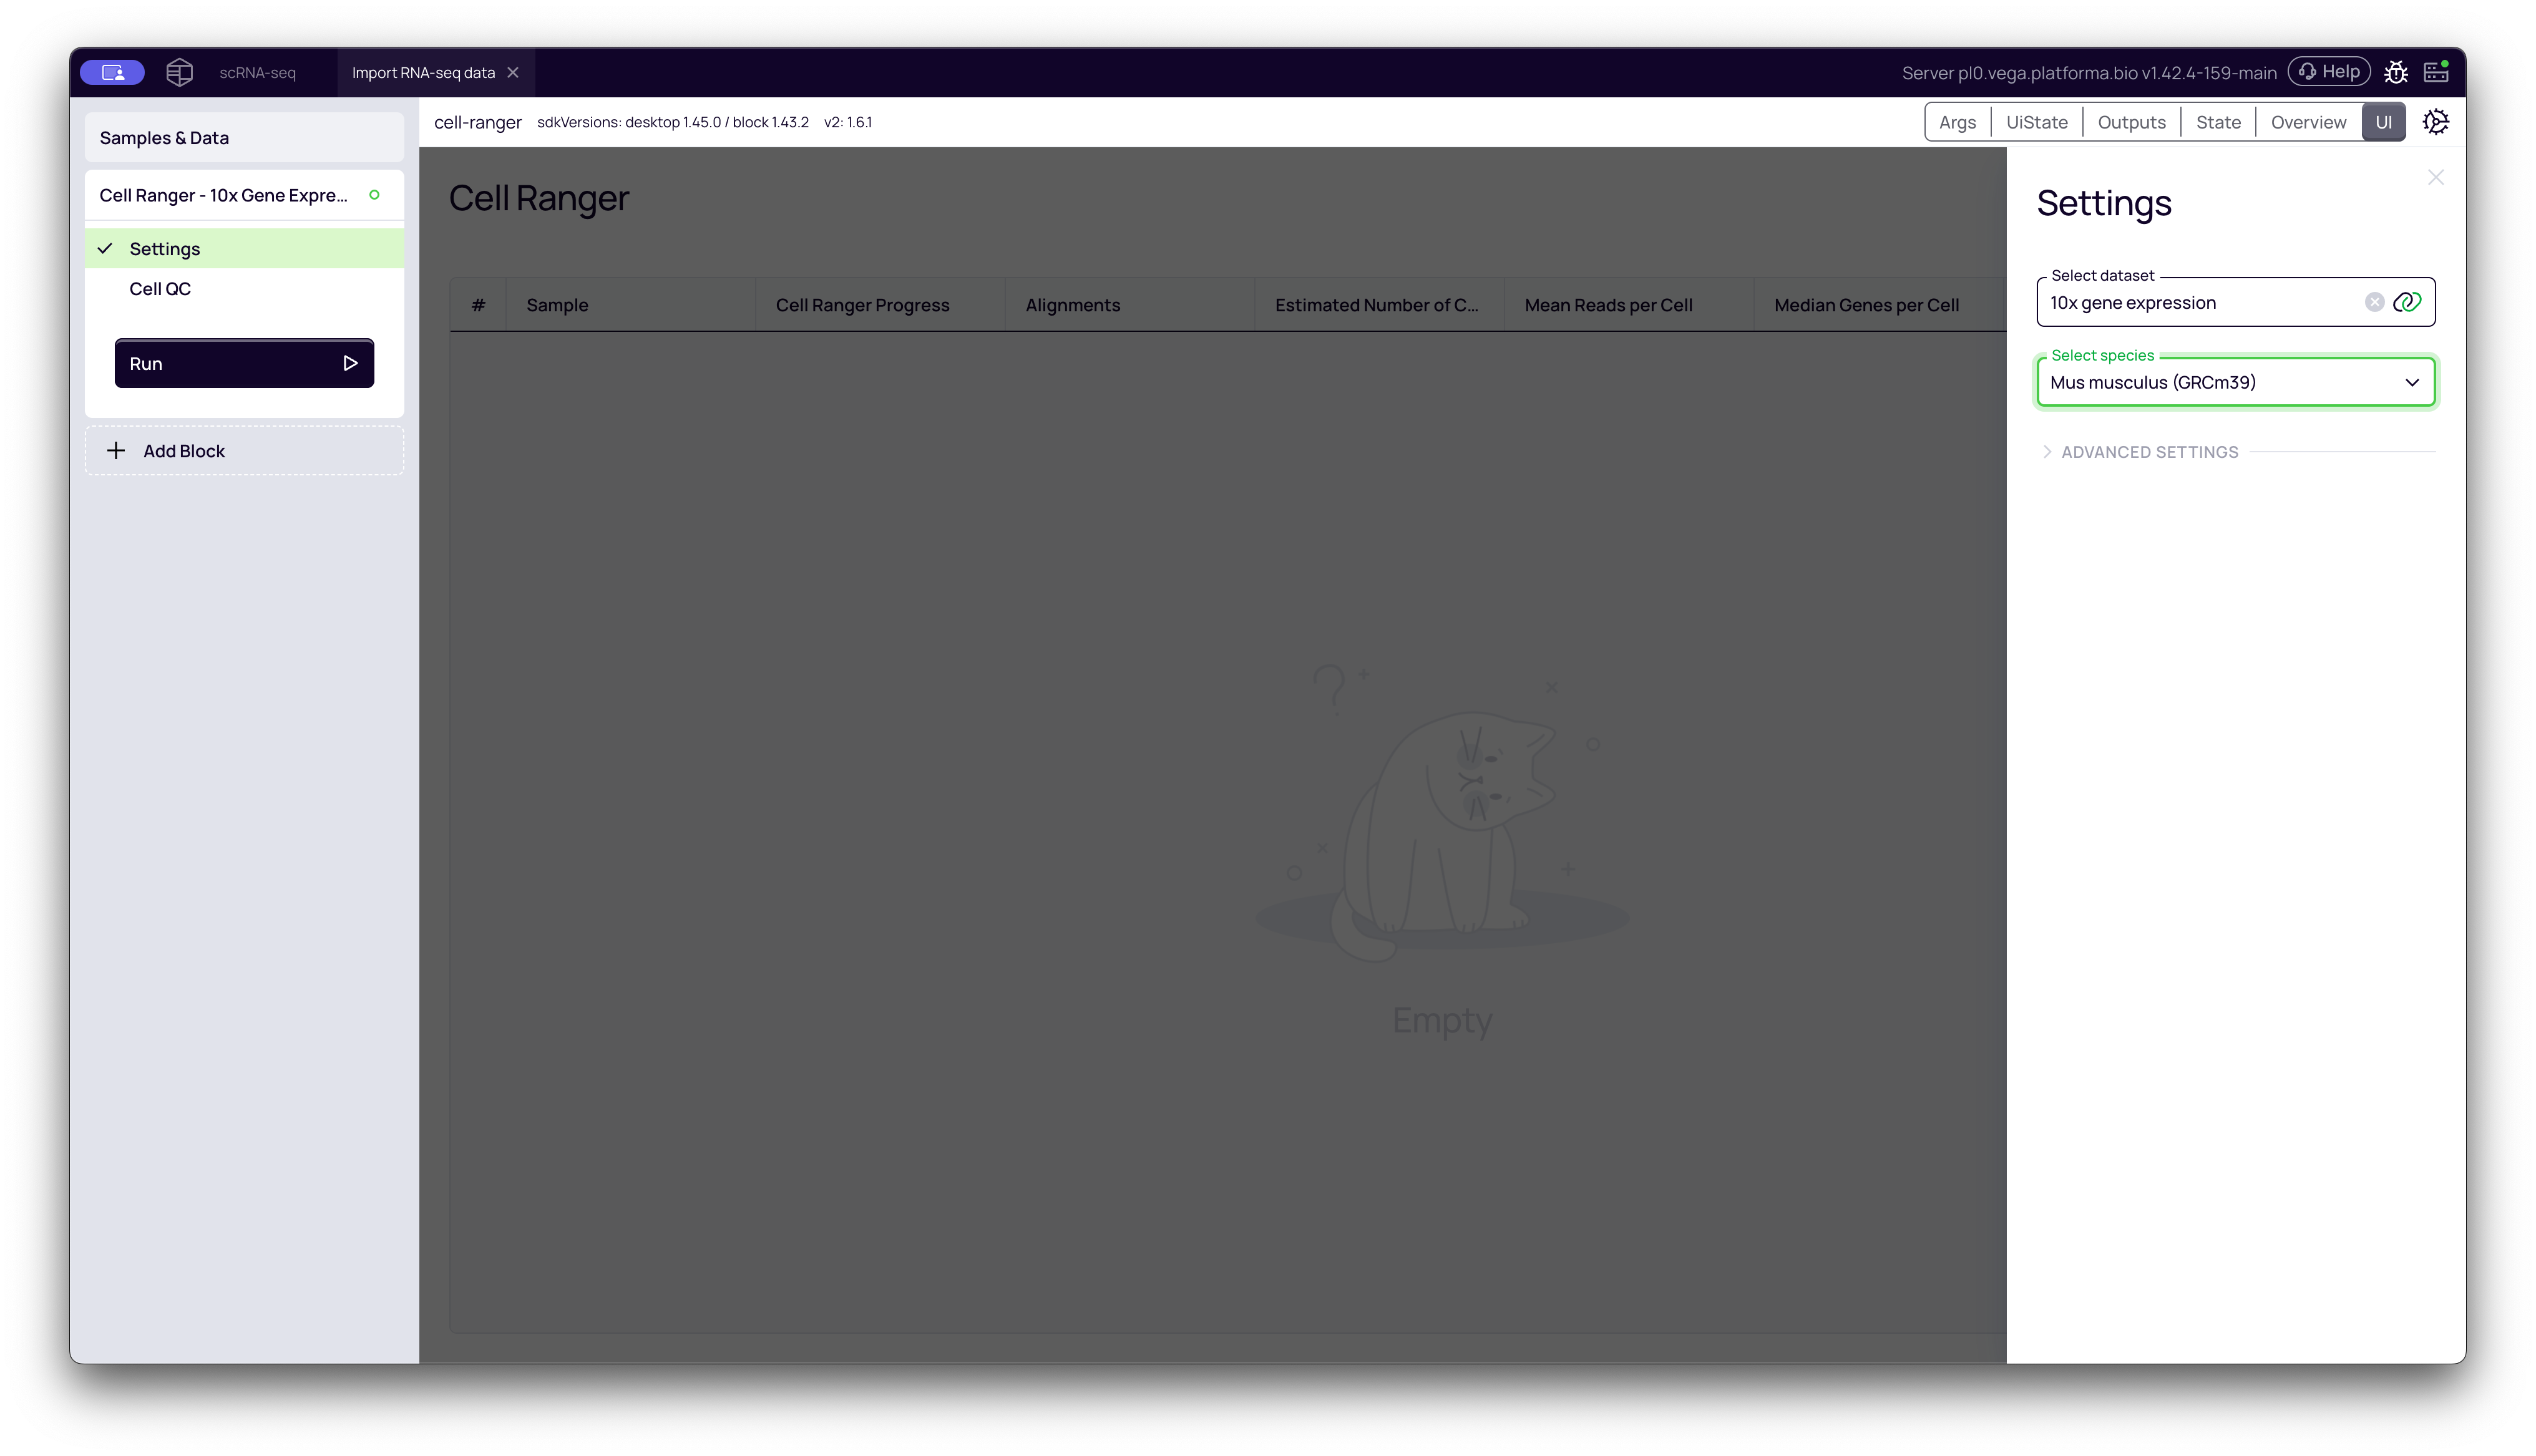
Once the block is added, you only need to configure two simple settings in the right-hand panel:
- Select dataset: Choose the dataset containing your FASTQ files. In our case, we select "10x gene expression".
- Select species: This determines which reference genome will be used for alignment. The default is Homo sapiens (Human). For this example, our data is from a mouse model, so we select Mus musculus (Mouse).
Once configured, click the Run button to start the analysis. Platforma will now process all samples in the dataset using Cell Ranger.
Interpreting the Cell Ranger Results
After the analysis is complete, the block will generate a main results table and detailed, interactive reports for each sample.
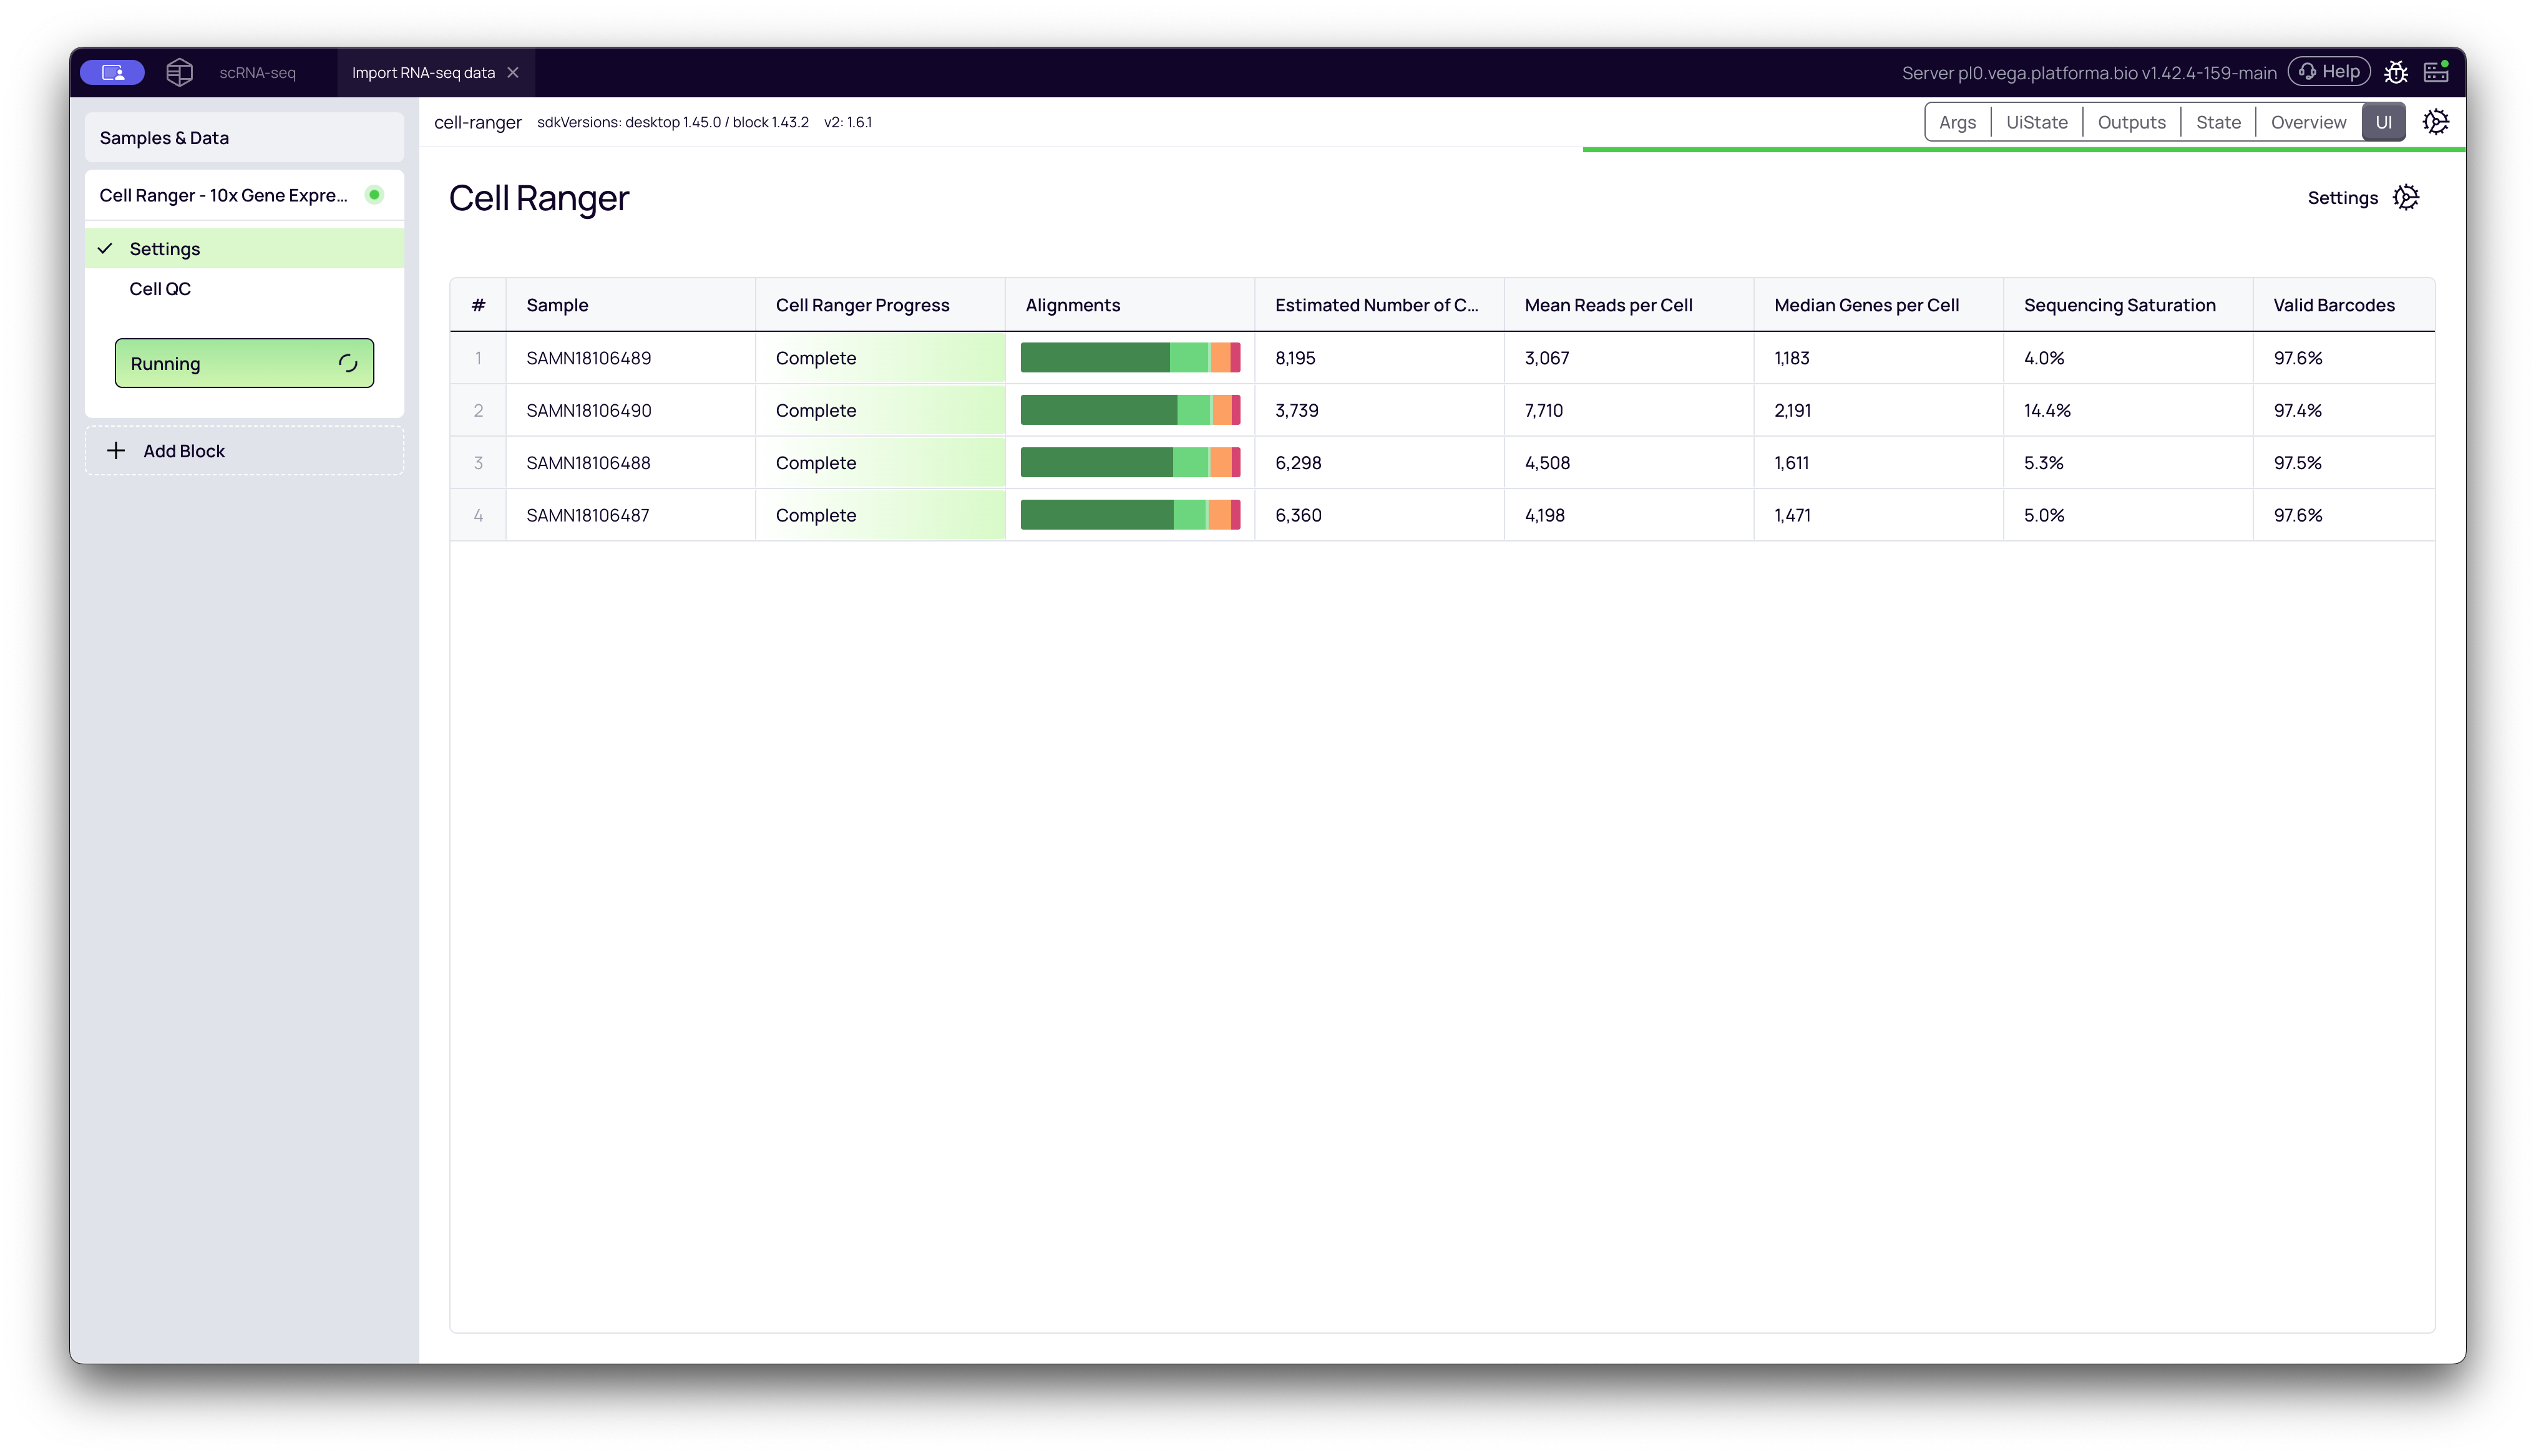
Results Overview Table
The main tab shows a summary table with key metrics for all samples, such as Estimated Number of Cells, Mean Reads per Cell, and Median Genes per Cell. This view is useful for quickly comparing QC metrics across your entire cohort.
To see the full report for a specific sample, click the Open button for that sample's row. This will open a new view with three tabs: Visual Report, Log, and Cell Ranger Web Summary.
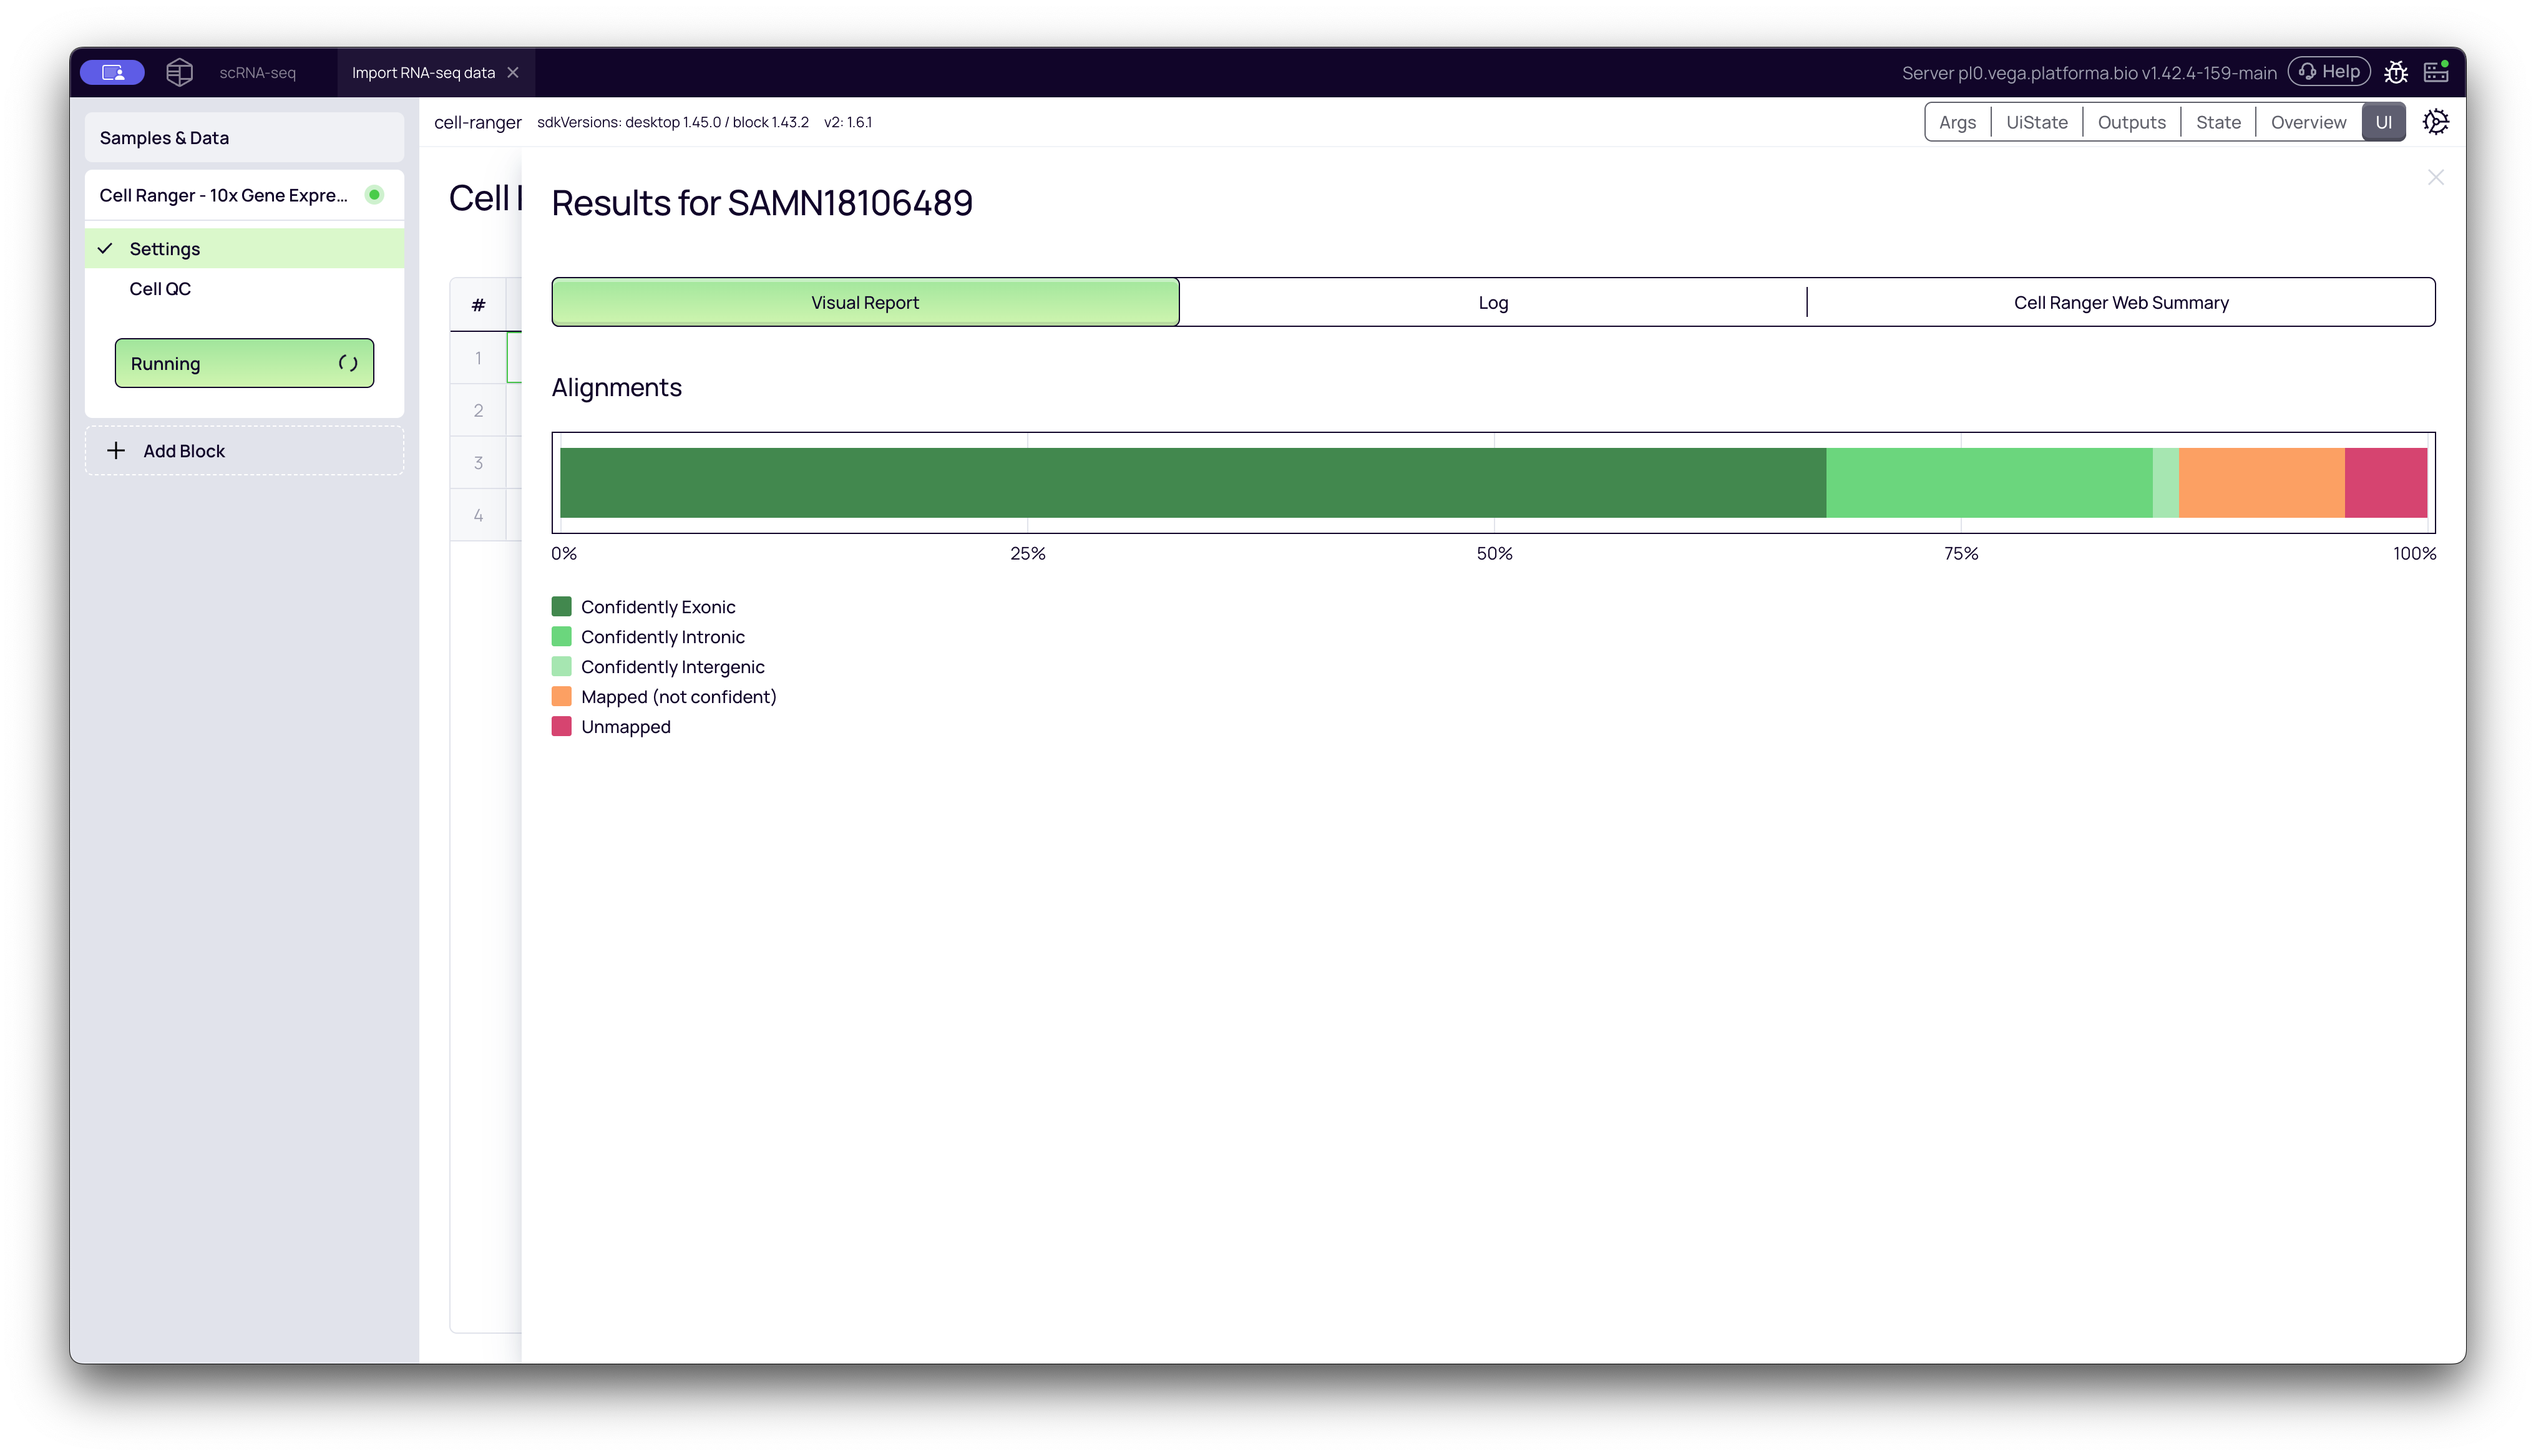
1. Visual Report (Alignment)
This tab provides a simple, high-level overview of the alignment rates. It shows a stacked bar chart detailing what percentage of reads were:
- Confidently Exonic: Mapped to an exon (the most useful reads).
- Confidently Intronic: Mapped to an intron.
- Confidently Intergenic: Mapped to a region between genes.
- Unmapped: Could not be aligned to the reference.
What to look for: A healthy sample will have a very high percentage of reads mapped to exonic and intronic regions, with very few unmapped reads.
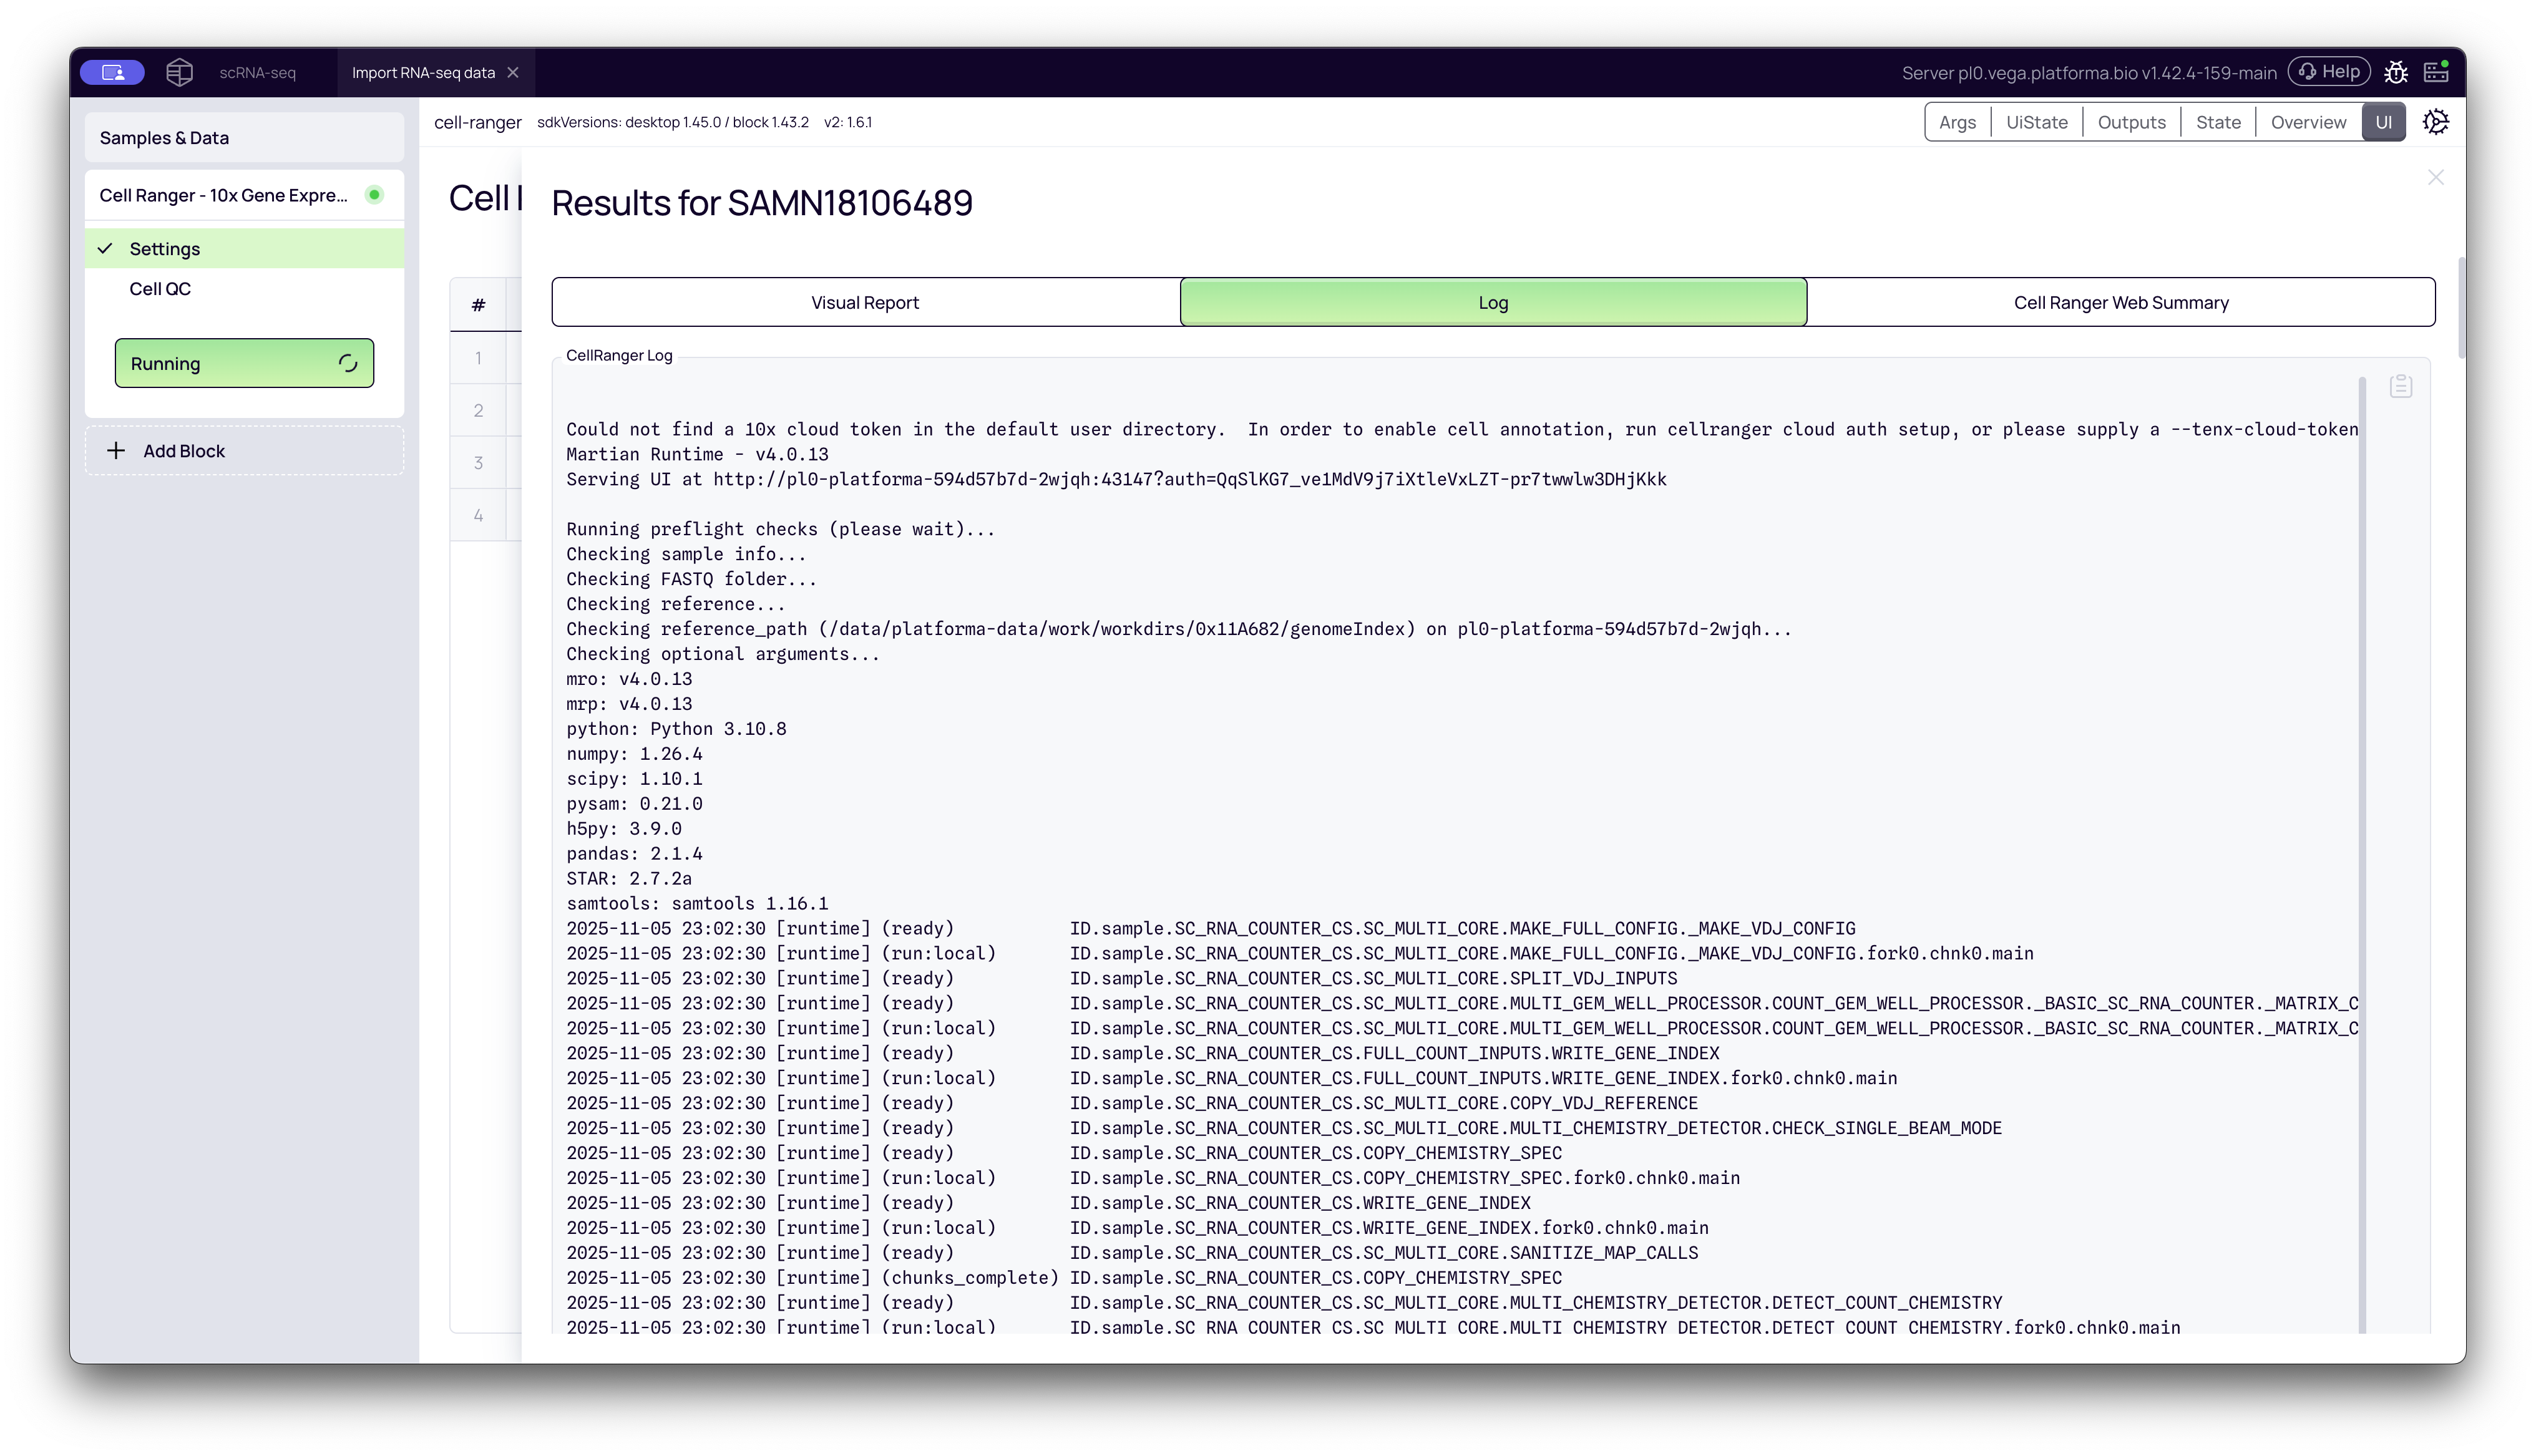
2. Log
This tab shows the raw, real-time log output from the Cell Ranger pipeline. This is useful for advanced troubleshooting if a specific sample fails.
3. Cell Ranger Web Summary (A Deep Dive)
This is the standard, interactive output report from 10x Genomics, embedded directly into Platforma. It is the most important output for quality control and initial data exploration. It is divided into two main sections: Summary and Gene Expression.
Summary Tab: Key QC Metrics
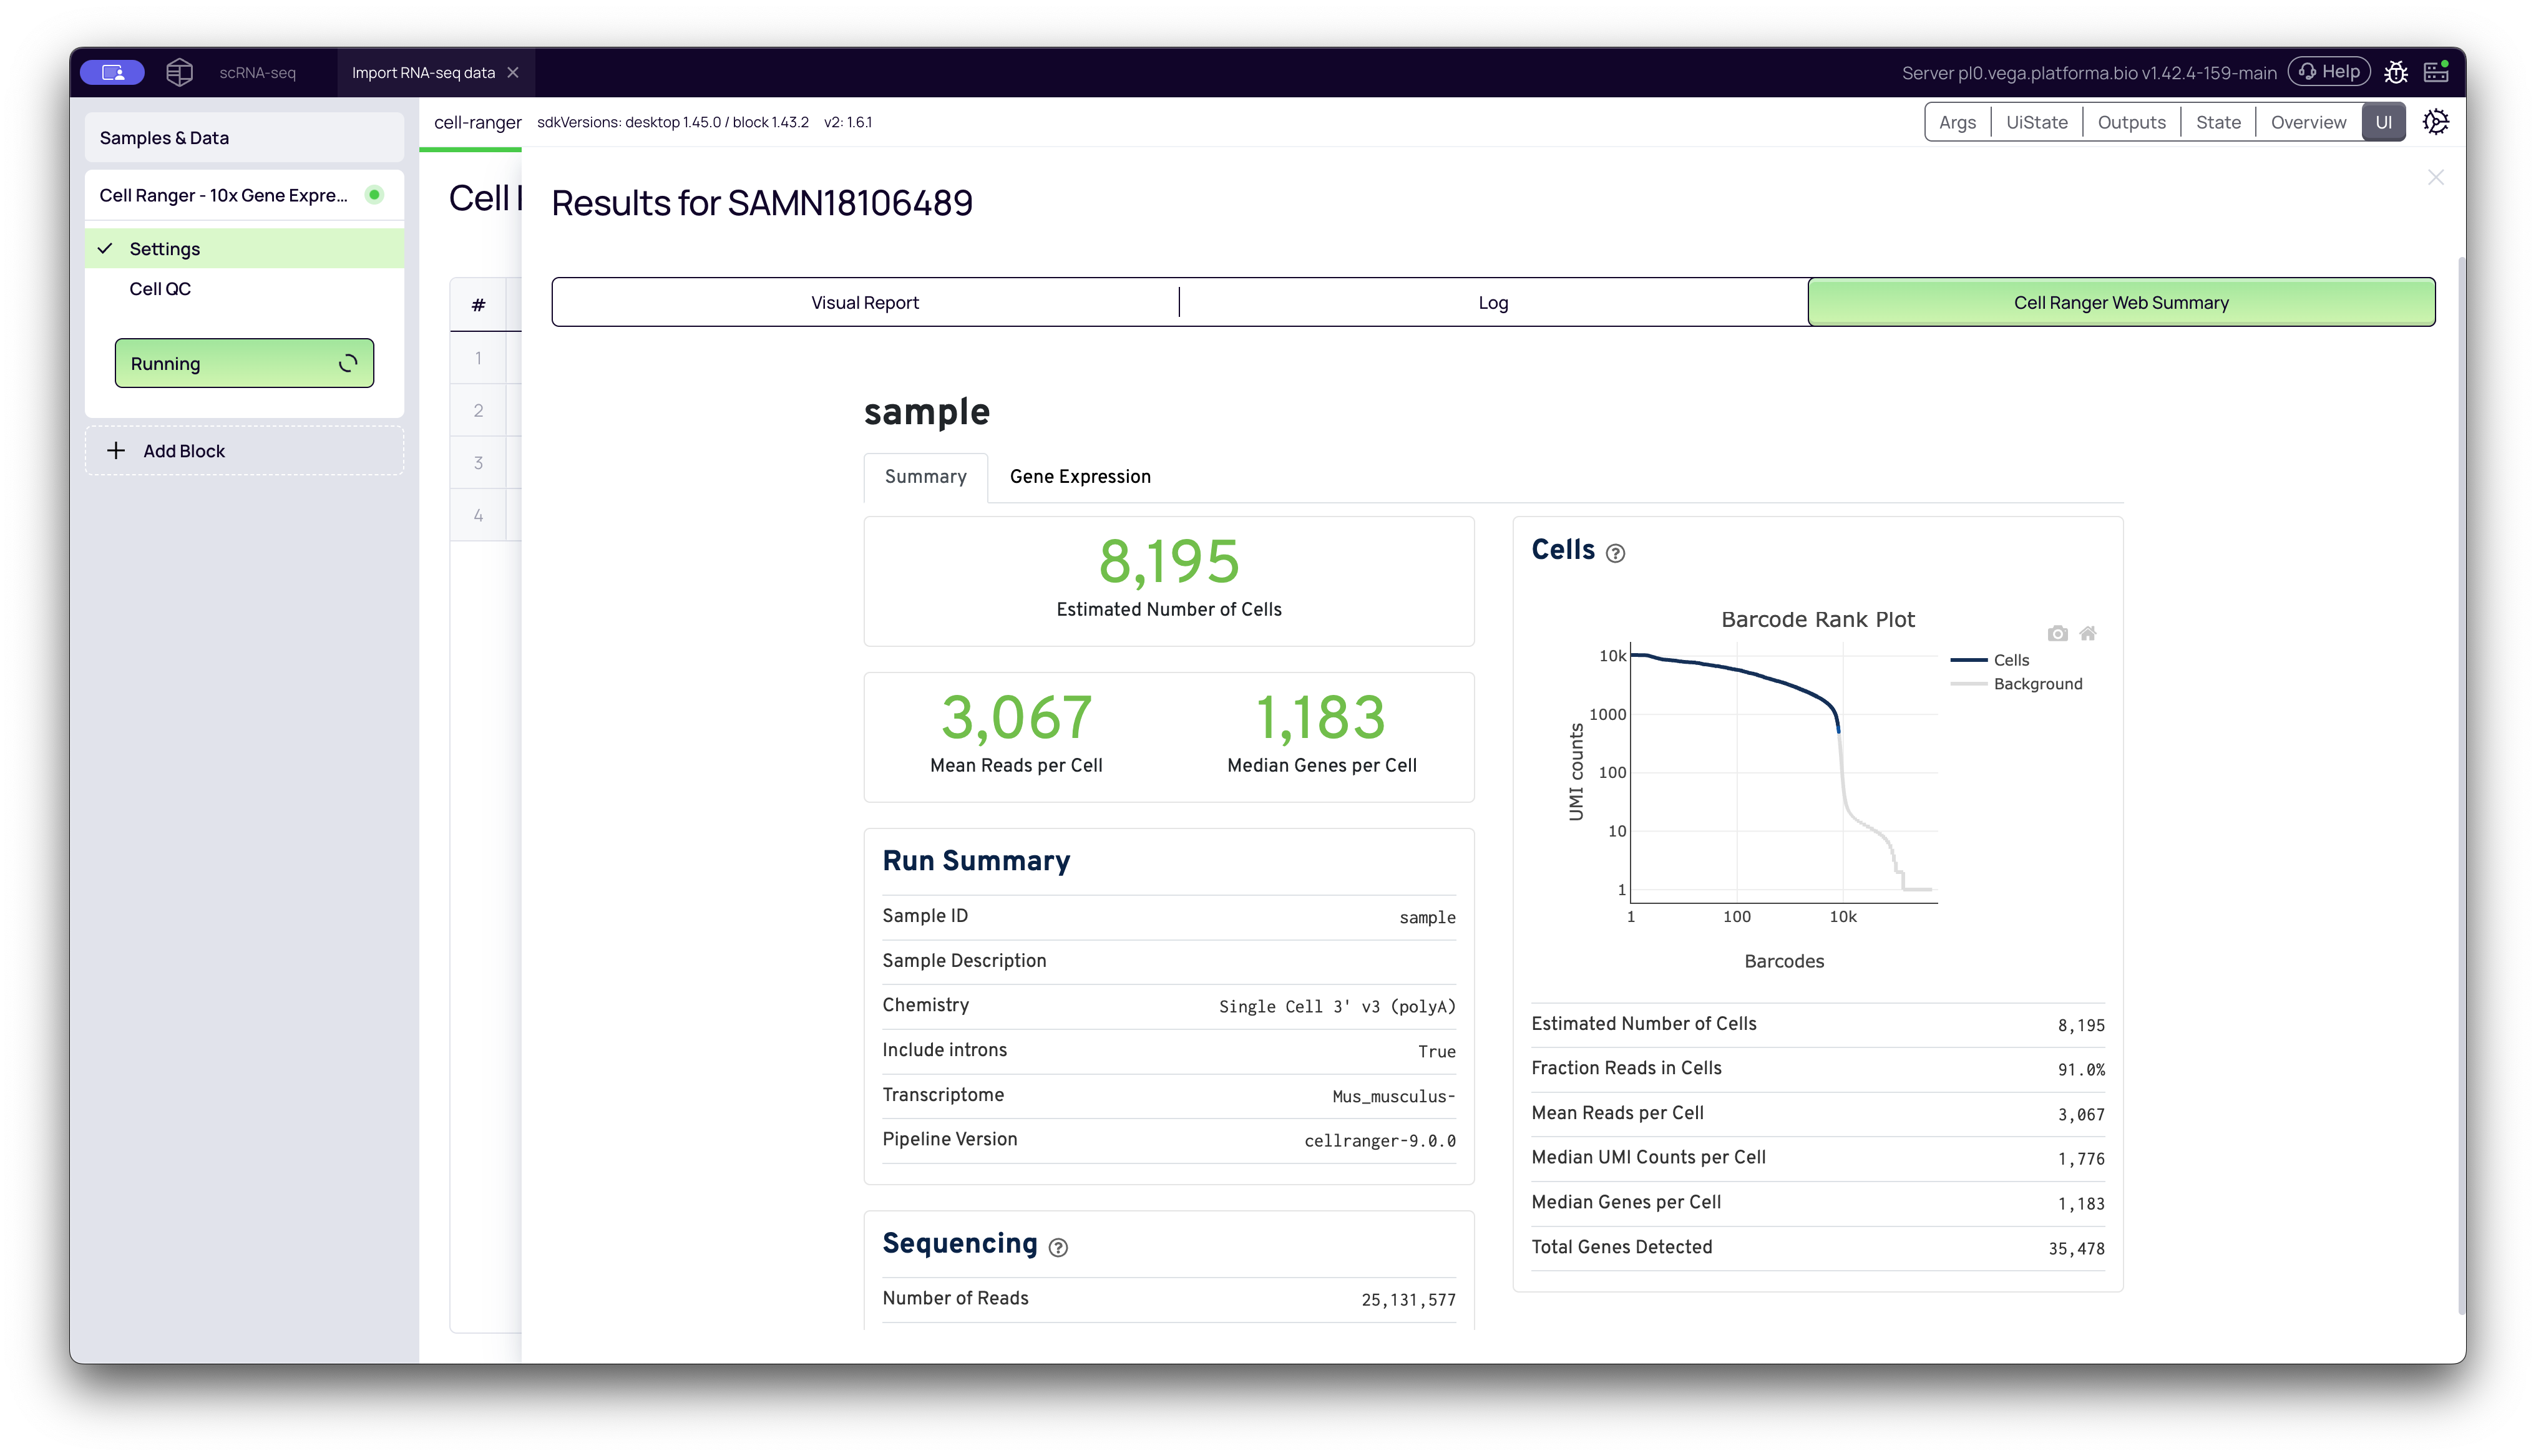
This tab focuses on the core metrics of cell calling and sequencing quality.
-
Barcode Rank Plot: This is the most critical QC plot. It plots all barcodes (x-axis, log scale) by their total UMI counts (y-axis, log scale).
- What it shows: It visualizes the "cliff and knee" of your data. The "cliff" on the left represents barcodes with many UMIs, which Cell Ranger calls as cells. The "knee" is the sharp drop-off that separates these cells from the "background" barcodes on the right, which have very few UMIs and are likely empty droplets or ambient RNA.
- What to look for: A sharp, steep drop-off (a "good knee") indicates a high-quality sample with a clear distinction between cells and background. A gradual slope (a "bad knee") can indicate high levels of ambient RNA or dead cells, which makes it difficult to distinguish real cells from noise.
-
Estimated Number of Cells: The total number of barcodes that Cell Ranger identified as high-quality cells (i.e., those to the left of the knee). This should be close to the number of cells you originally loaded.
-
Mean Reads per Cell: The average number of raw sequencing reads associated with each called cell. 10x Genomics often recommends a minimum of 20,000 reads/cell for good gene detection, but this depends on your experiment.
-
Median Genes per Cell: The median number of unique genes detected per cell. This is a measure of cellular complexity and is highly dependent on cell type (e.g., neurons will have more than red blood cells).
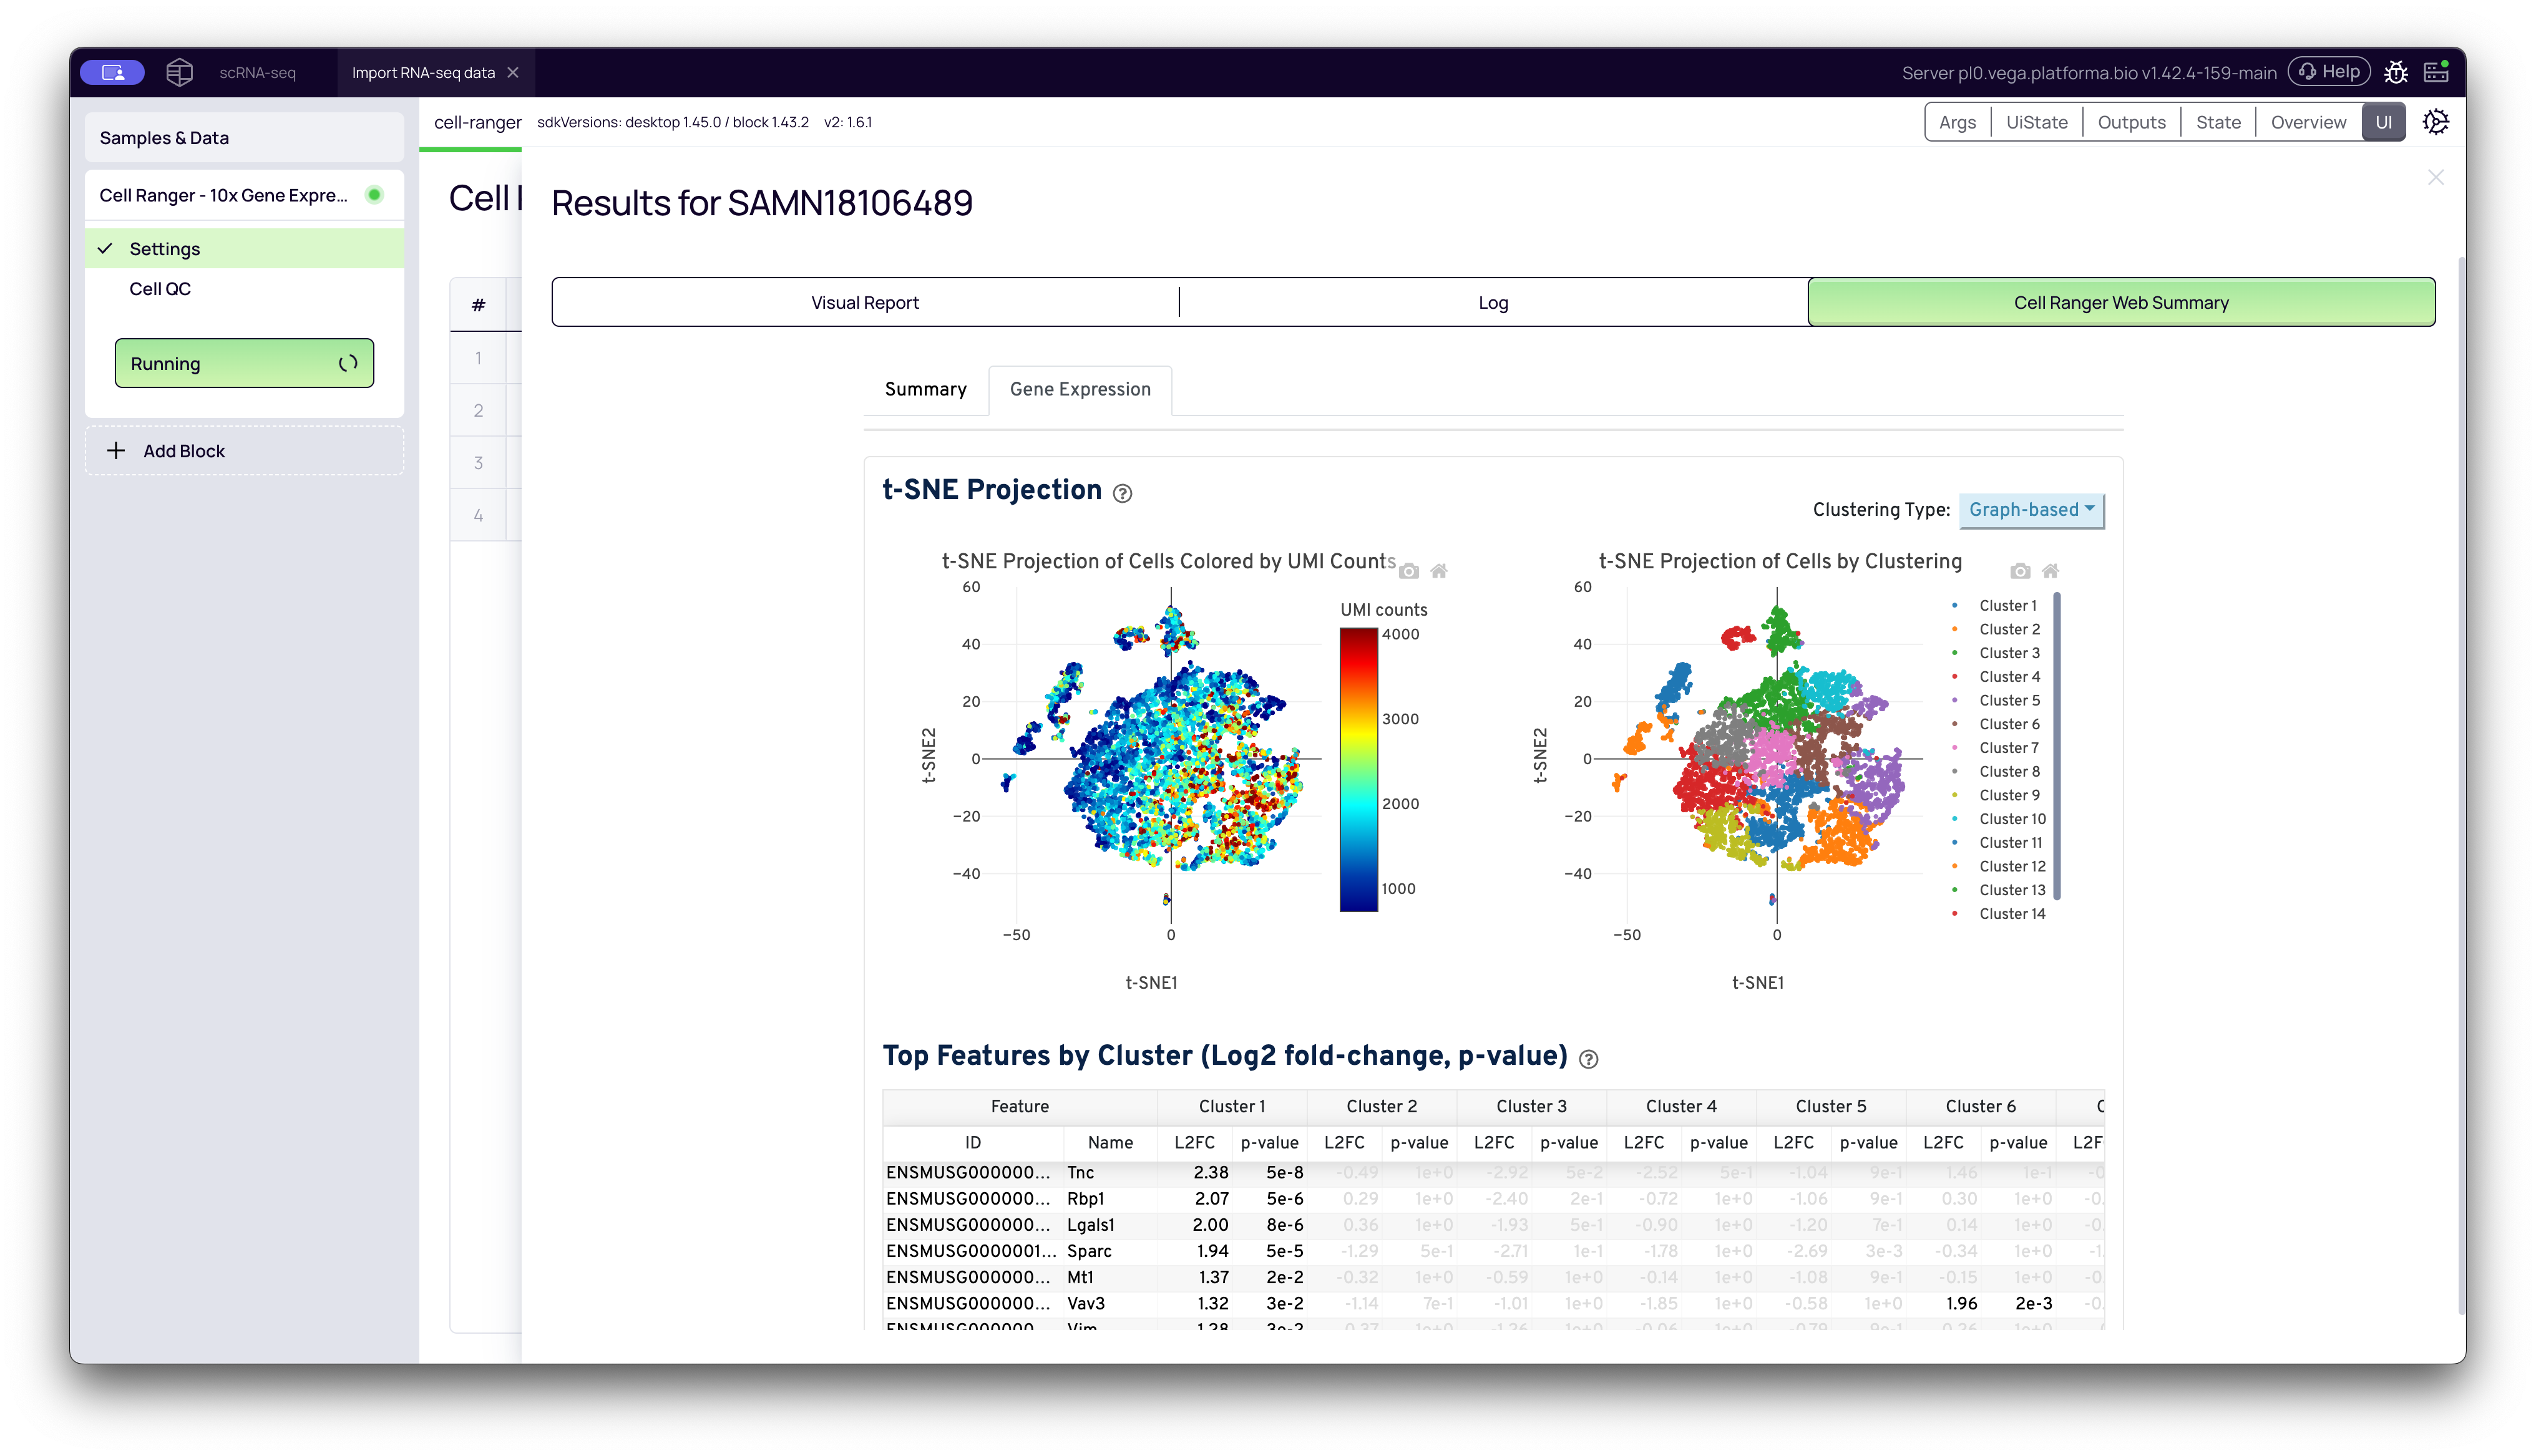
Gene Expression Tab: Clustering and Markers
This tab shows the results of Cell Ranger's automated secondary analysis, including clustering and marker gene identification.
-
t-SNE Projections: A t-SNE (t-distributed Stochastic Neighbor Embedding) plot is a visualization that reduces the complex, high-dimensional gene expression data for each cell down to a 2D map. Cells with similar gene expression profiles are plotted close together.
-
By Clustering: This plot shows the cells colored by the automated clustering performed by Cell Ranger. It gives you a first look at the different cell populations (clusters) present in your sample.
-
By UMI Counts: This is the same plot, but colored by the number of UMIs in each cell. It can reveal if any clusters are being driven by technical factors (like high UMI counts) rather than biology.
Important Note: When interpreting t-SNE plots, only the groupings of cells (the clusters) are meaningful. The distance between two separate clusters does not mean anything, and the X/Y axes (tSNE-1, tSNE-2) have no direct biological interpretation.
-
-
Top Features by Cluster (Marker Genes): This table lists the genes that are most differentially expressed in each cluster relative to all other clusters.
- How to use it: You can sort the table by columns like L2FC (Log2 Fold Change) or p-value for a specific cluster (e.g., "Cluster 1") to see the genes that define that population. This is the first step in identifying your clusters (e.g., "Cluster 1 is likely T-cells because it highly expresses Cd3e and Cd4").
- QC Note: Be cautious if the top "markers" for a cluster are all mitochondrial or ribosomal genes. This often indicates that the cluster is composed of stressed, dying, or low-quality cells.
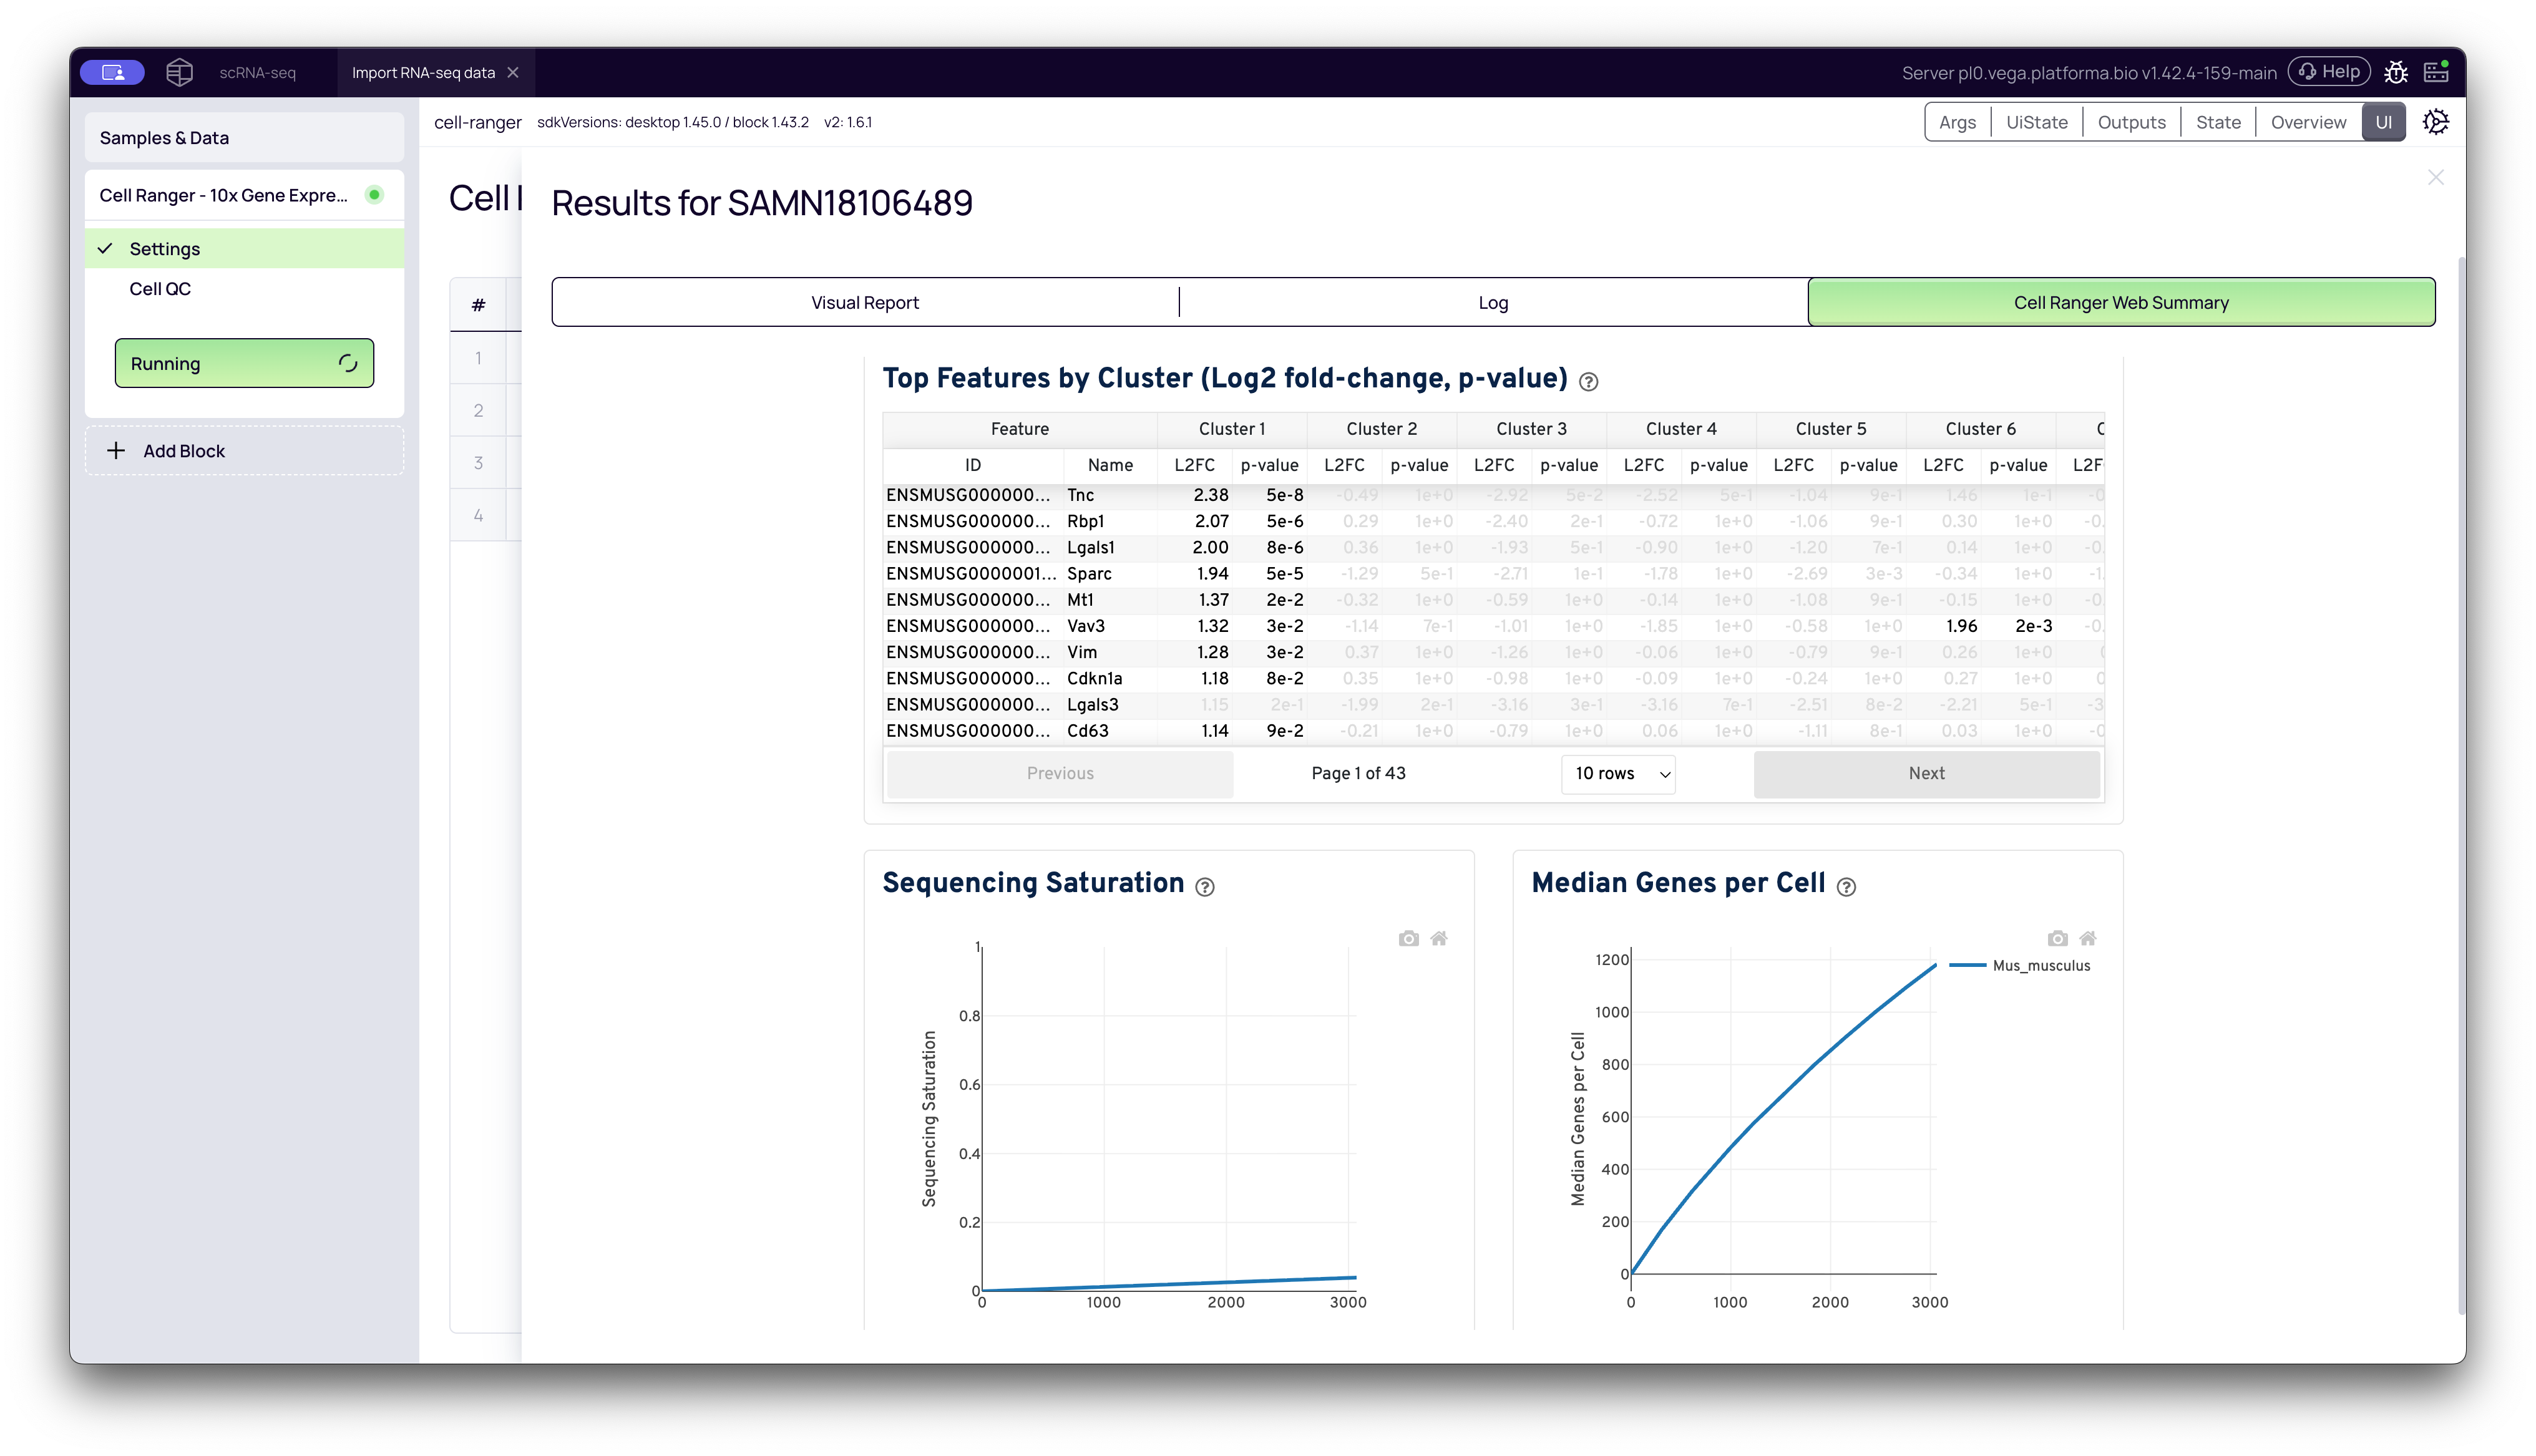
- Sequencing Saturation Plot: This plot measures the "complexity" of your library. It shows what percentage of the library's unique molecules (UMIs) you have detected at your current sequencing depth.
- Interpretation: A high saturation (e.g., 90%) means you have found most of the unique transcripts, and sequencing deeper would yield diminishing returns. A low saturation (e.g., 50%) means you could still discover many new unique transcripts by sequencing deeper. Your target saturation depends on your biological question.
Practical QC Checklist: What to Look For
Here is a quick checklist for assessing your Cell Ranger results.
| Metric / Plot | A Good Result Looks Like... | A Red Flag Looks Like... |
|---|---|---|
| Barcode Rank Plot | A sharp "cliff and knee" shape. | A gradual slope with no clear "knee." |
| Estimated Number of Cells | Close to the number of cells you loaded. | Drastically lower or higher than expected. |
| Mapping Rate (Visual Report) | High % of reads mapped to exons (e.g., >85% for human/mouse). | High % of unmapped reads or intergenic reads. |
| Median Genes per Cell | A high number (e.g., 1,000+), but this is very cell-type dependent. | Very low numbers (e.g., <500) for what should be complex cells. |
| t-SNE Clusters | Clear, distinct clusters separated from each other. | All cells are in one big, undefined blob. |
| Top Features Table | Clusters are defined by known, relevant biological markers. | Clusters are defined by high mitochondrial or ribosomal genes. |
By running the Cell Ranger block and reviewing these key reports, you can confidently quality-control your data before proceeding to downstream analysis.