Importing Pre-processed scRNA-seq Data
While Platforma offers powerful tools for processing raw sequencing data (FASTQ), you can also start your analysis directly with pre-processed gene expression matrices. This is ideal if you have legacy data, public datasets, or outputs from other pipelines like Cell Ranger, Seurat, or Scanpy.
This guide documents the supported file formats and configuration settings for the Samples & Data block and the downstream Import scRNA-seq Data block.
Supported File Formats
Platforma supports imports from the most common single-cell file standards. When uploading files in the Samples & Data block, ensure you select the correct Type in the import modal to access specific configuration options.
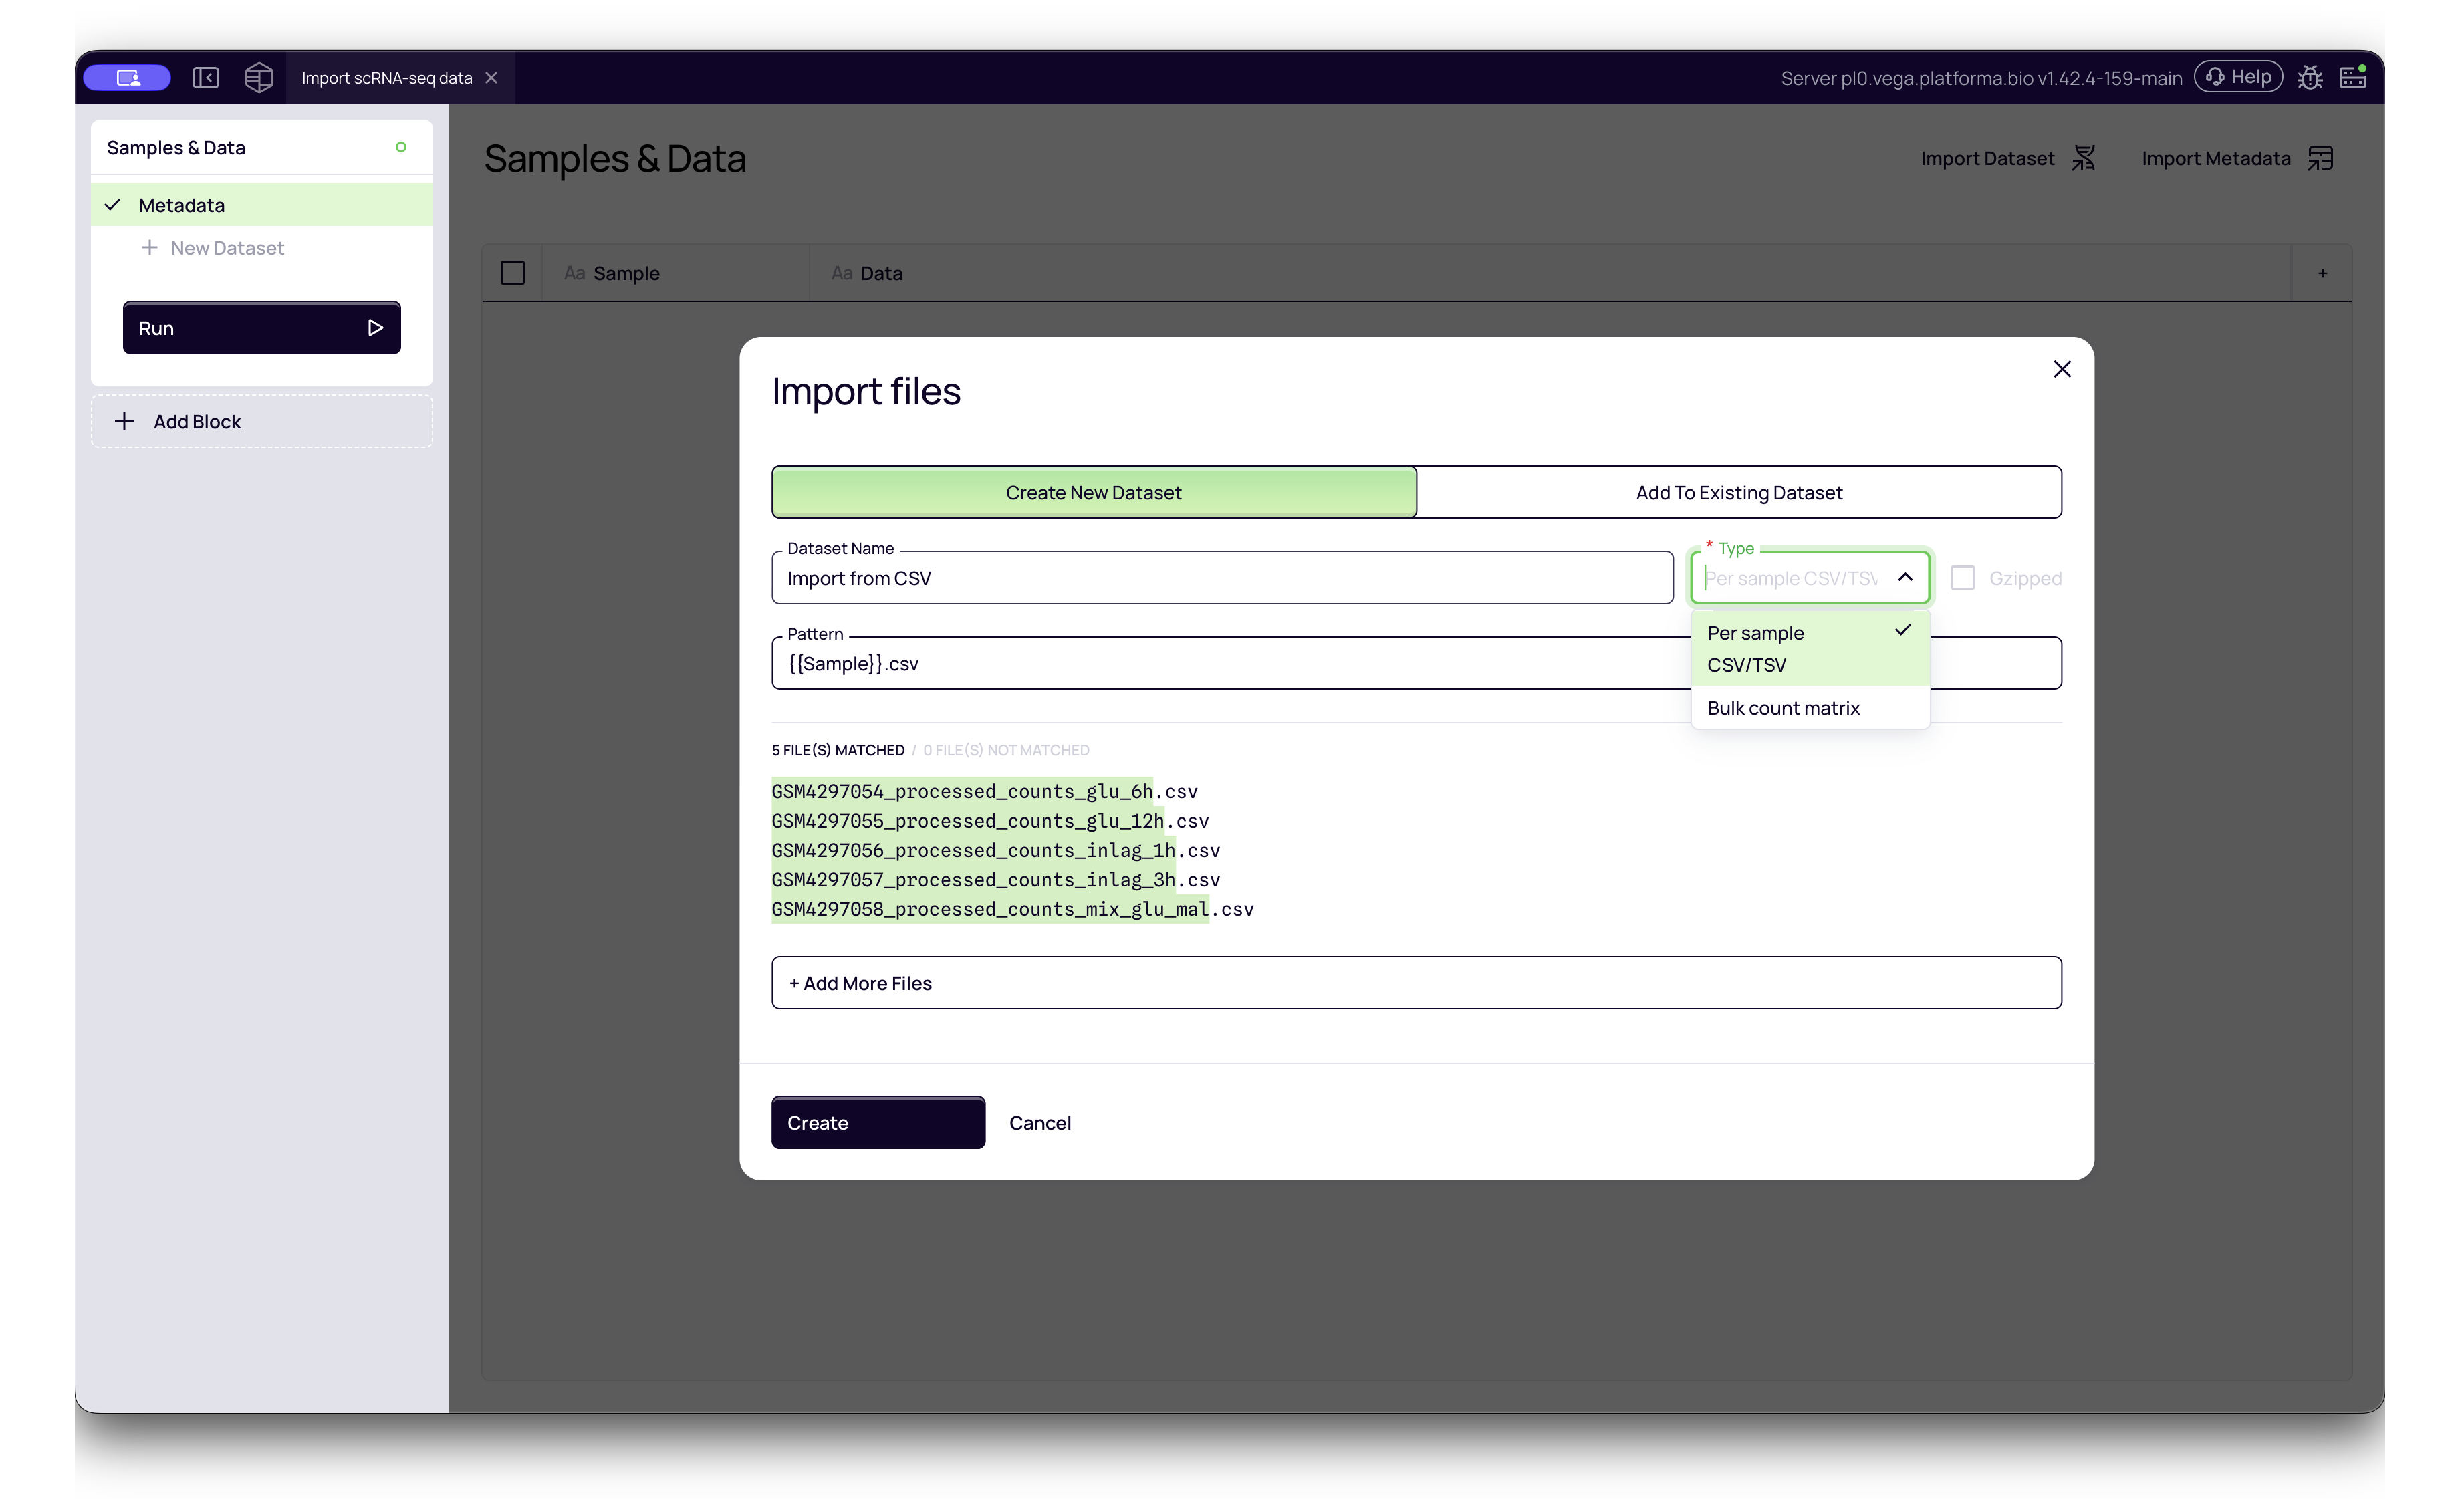
1. CSV / TSV Matrices
You can import simple text-based count matrices where rows represent genes and columns represent cells (or vice versa).
- Platforma Type:
Per sample CSV/TSVorBulk count matrix - Single Sample: Upload one CSV file per sample.
- Multi-Sample: If you have a single CSV containing data for multiple samples, you can import it as one file. You will be prompted to identify the specific column containing Sample Names to demultiplex the data automatically.
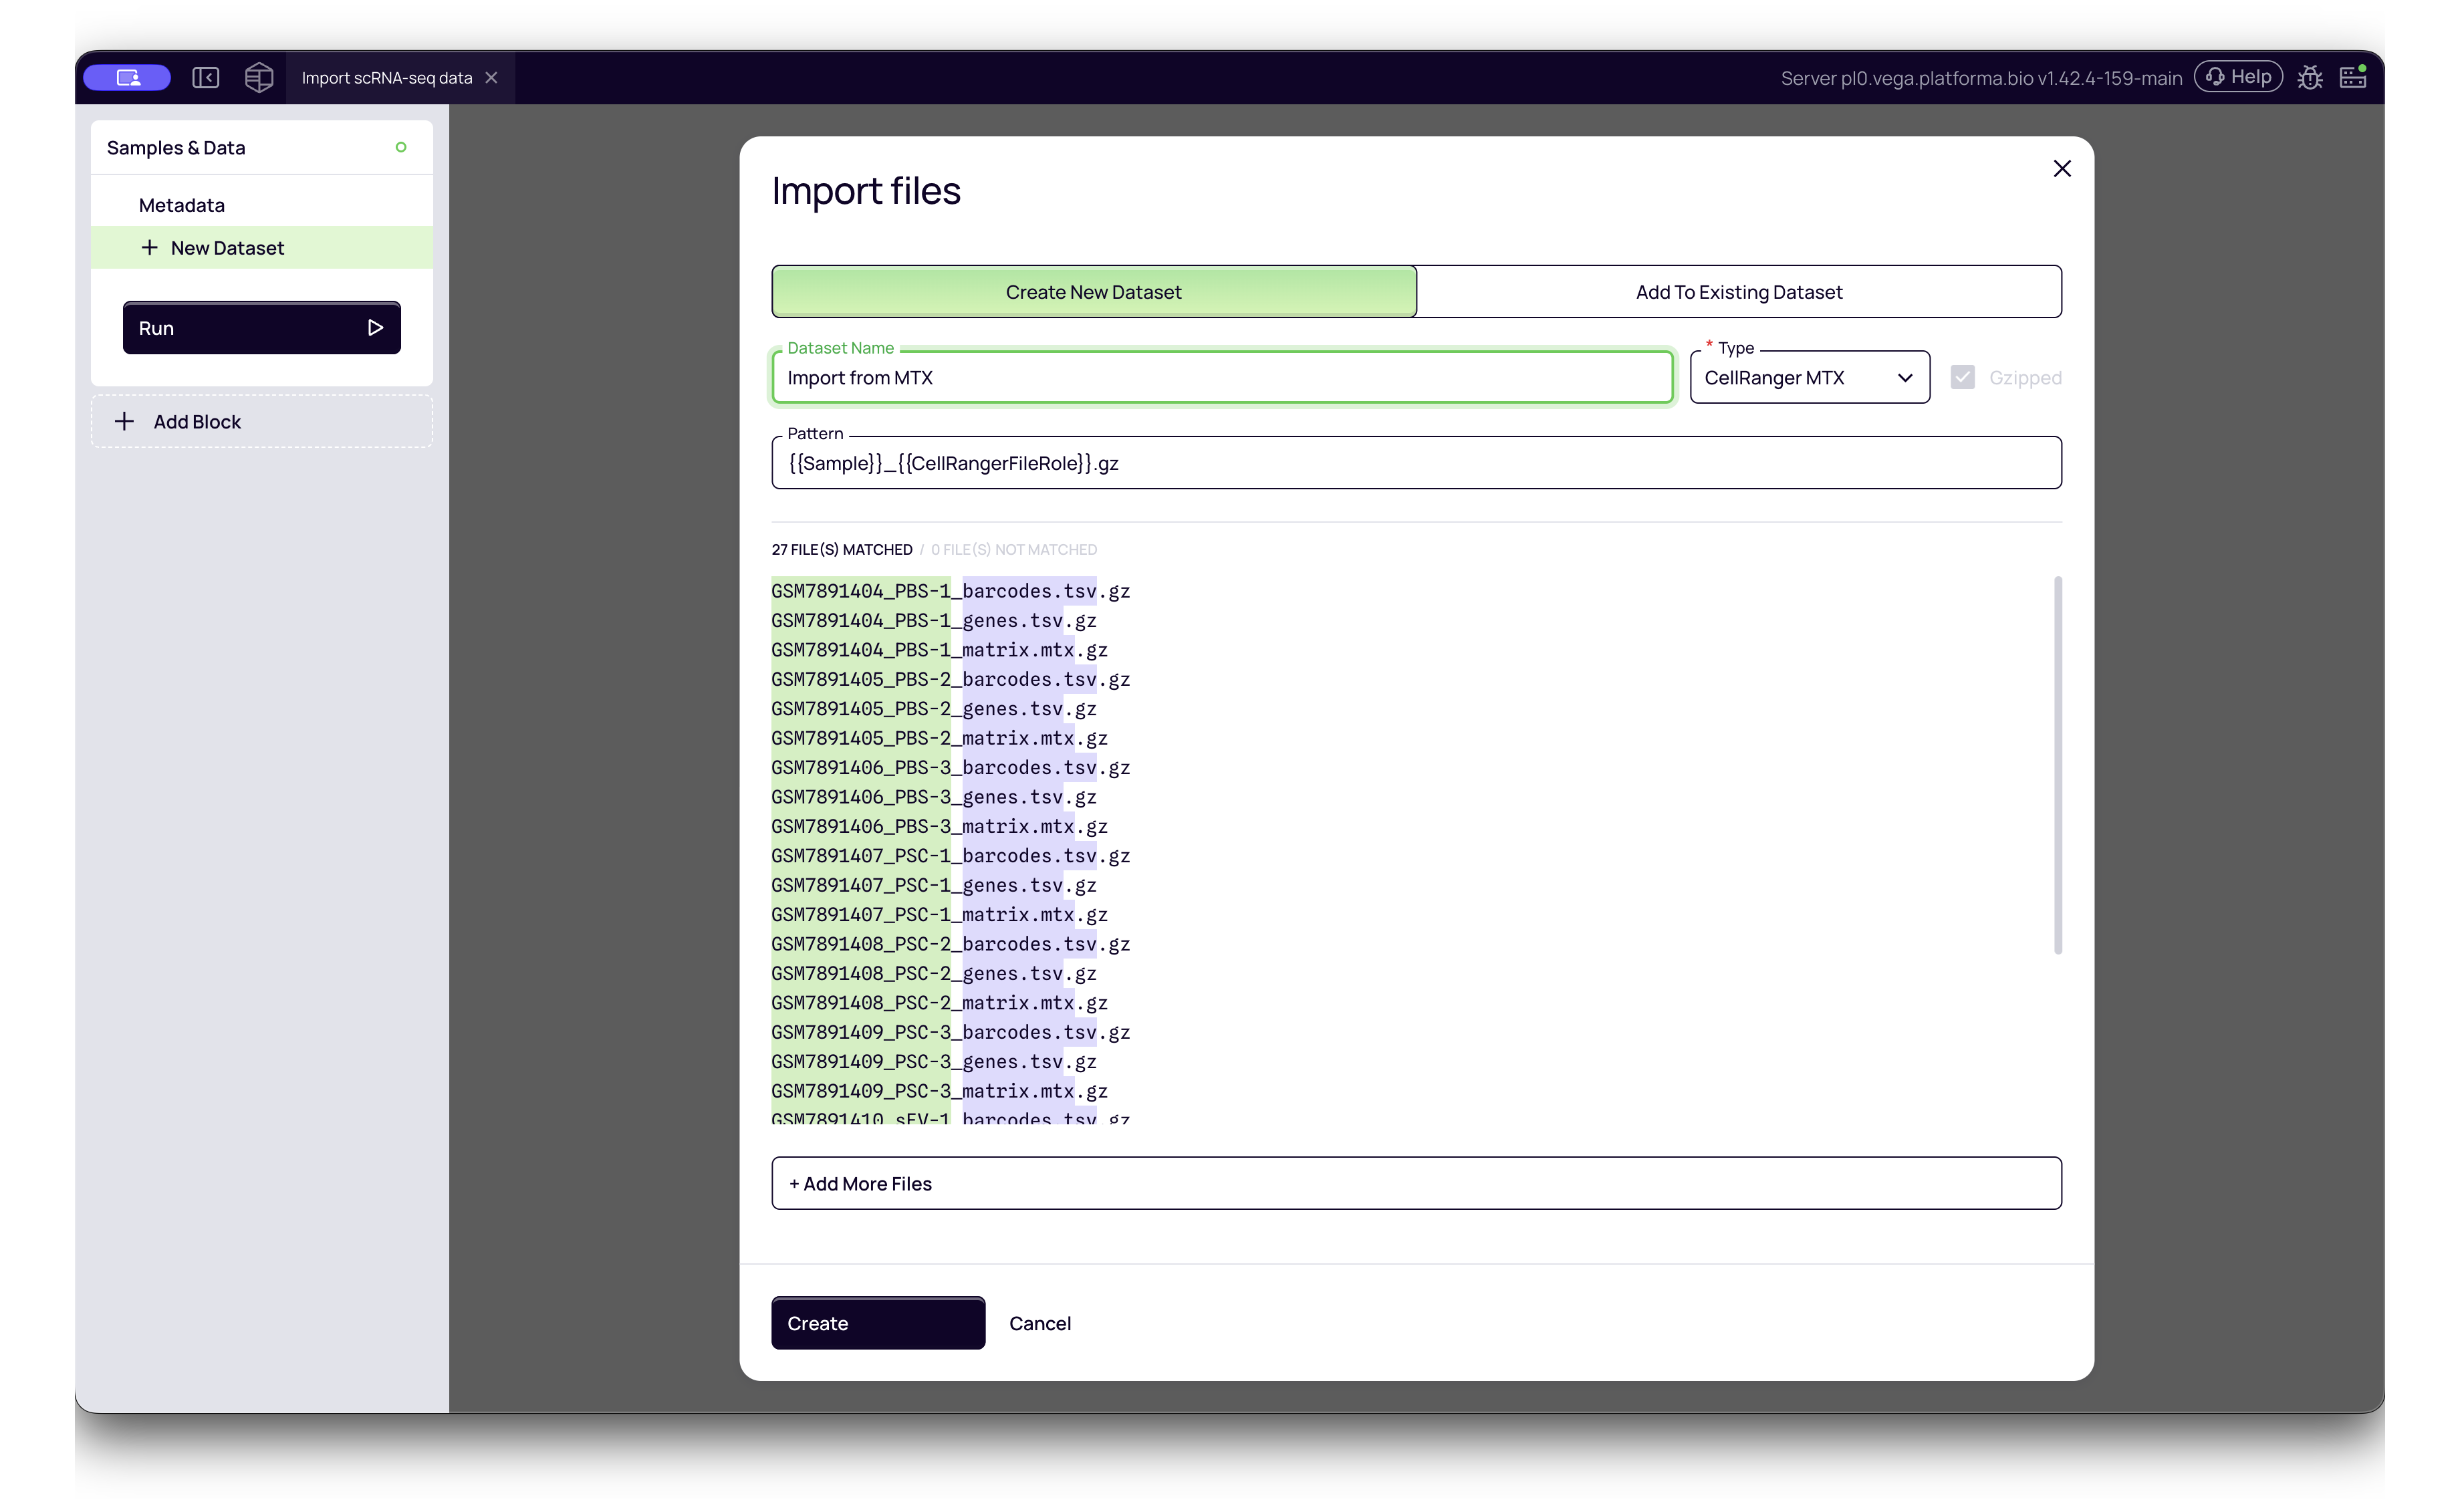
2. MTX
This is the standard sparse matrix output from 10x Genomics Cell Ranger. It typically consists of three files per sample folder:
matrix.mtxbarcodes.tsvgenes.tsv(orfeatures.tsv)
- Platforma Type:
CellRanger MTX - How to import: Select all three files for a sample simultaneously. Platforma will automatically recognize them as a single dataset entry.
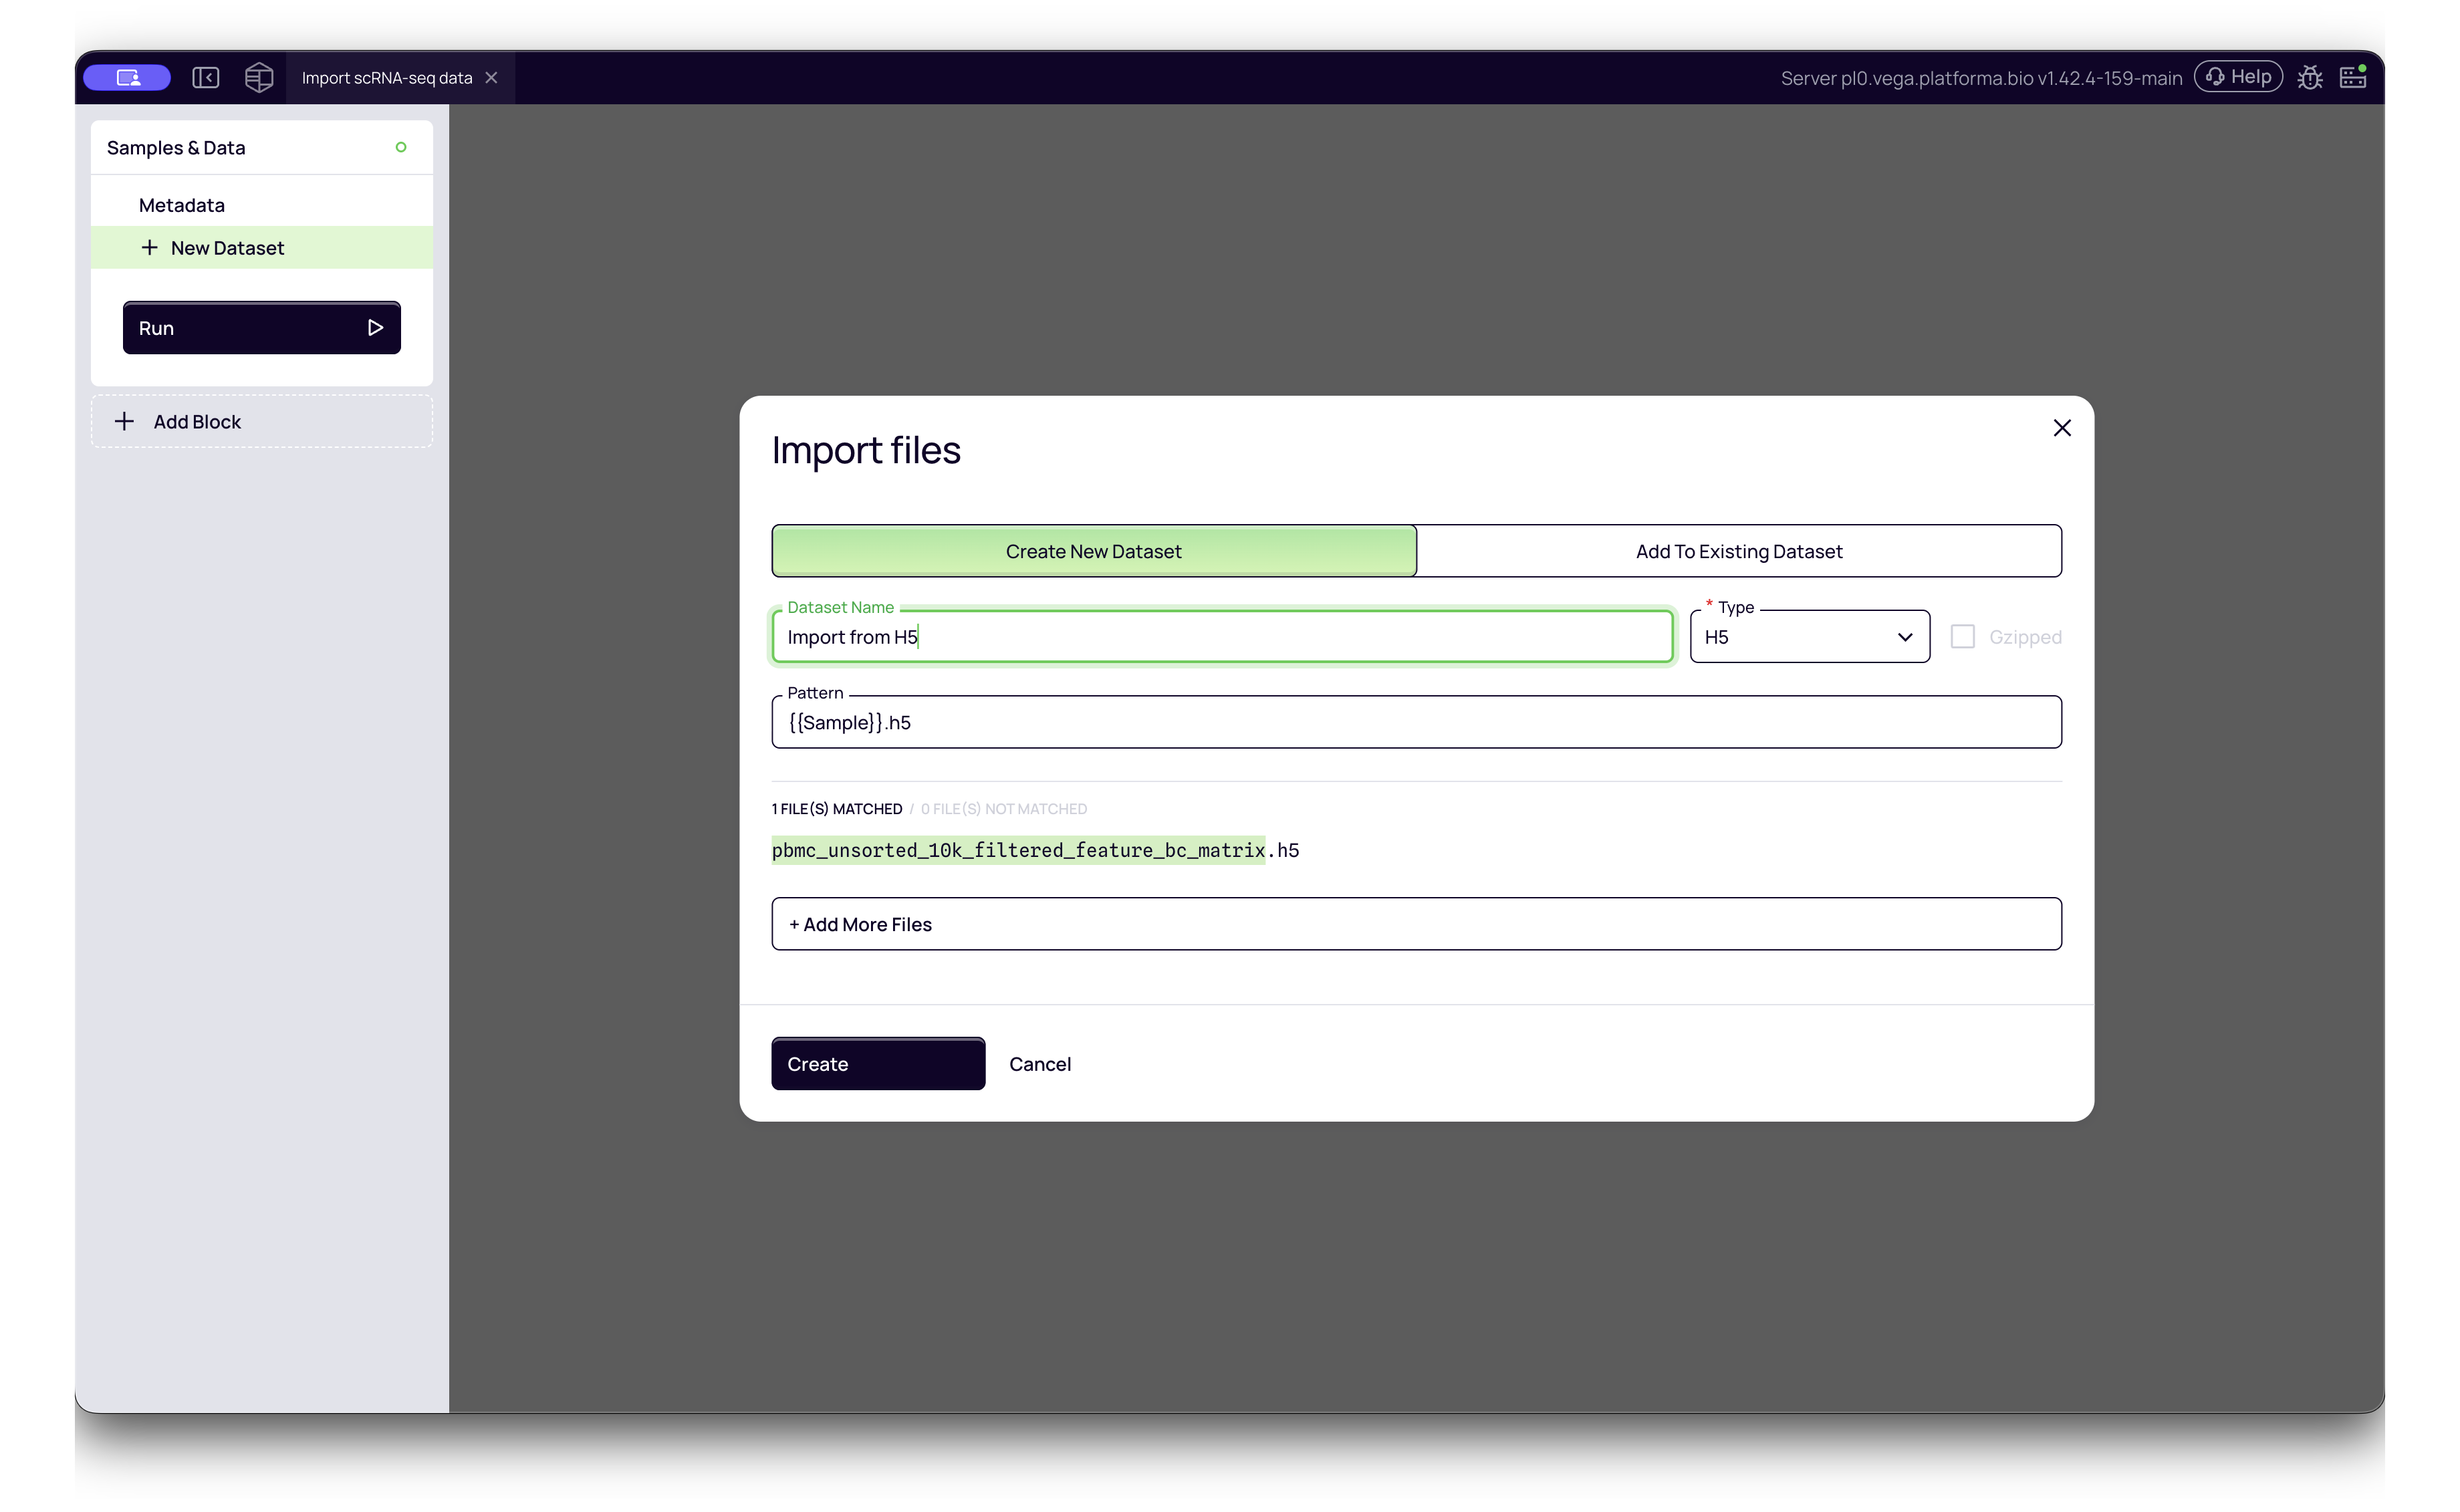
3. HDF5 (.h5)
The binary output format from Cell Ranger pipelines. It is more compact and faster to load than MTX files.
- Platforma Type:
H5 - How to import: Simply select the
.h5file. No extra configuration is usually required.
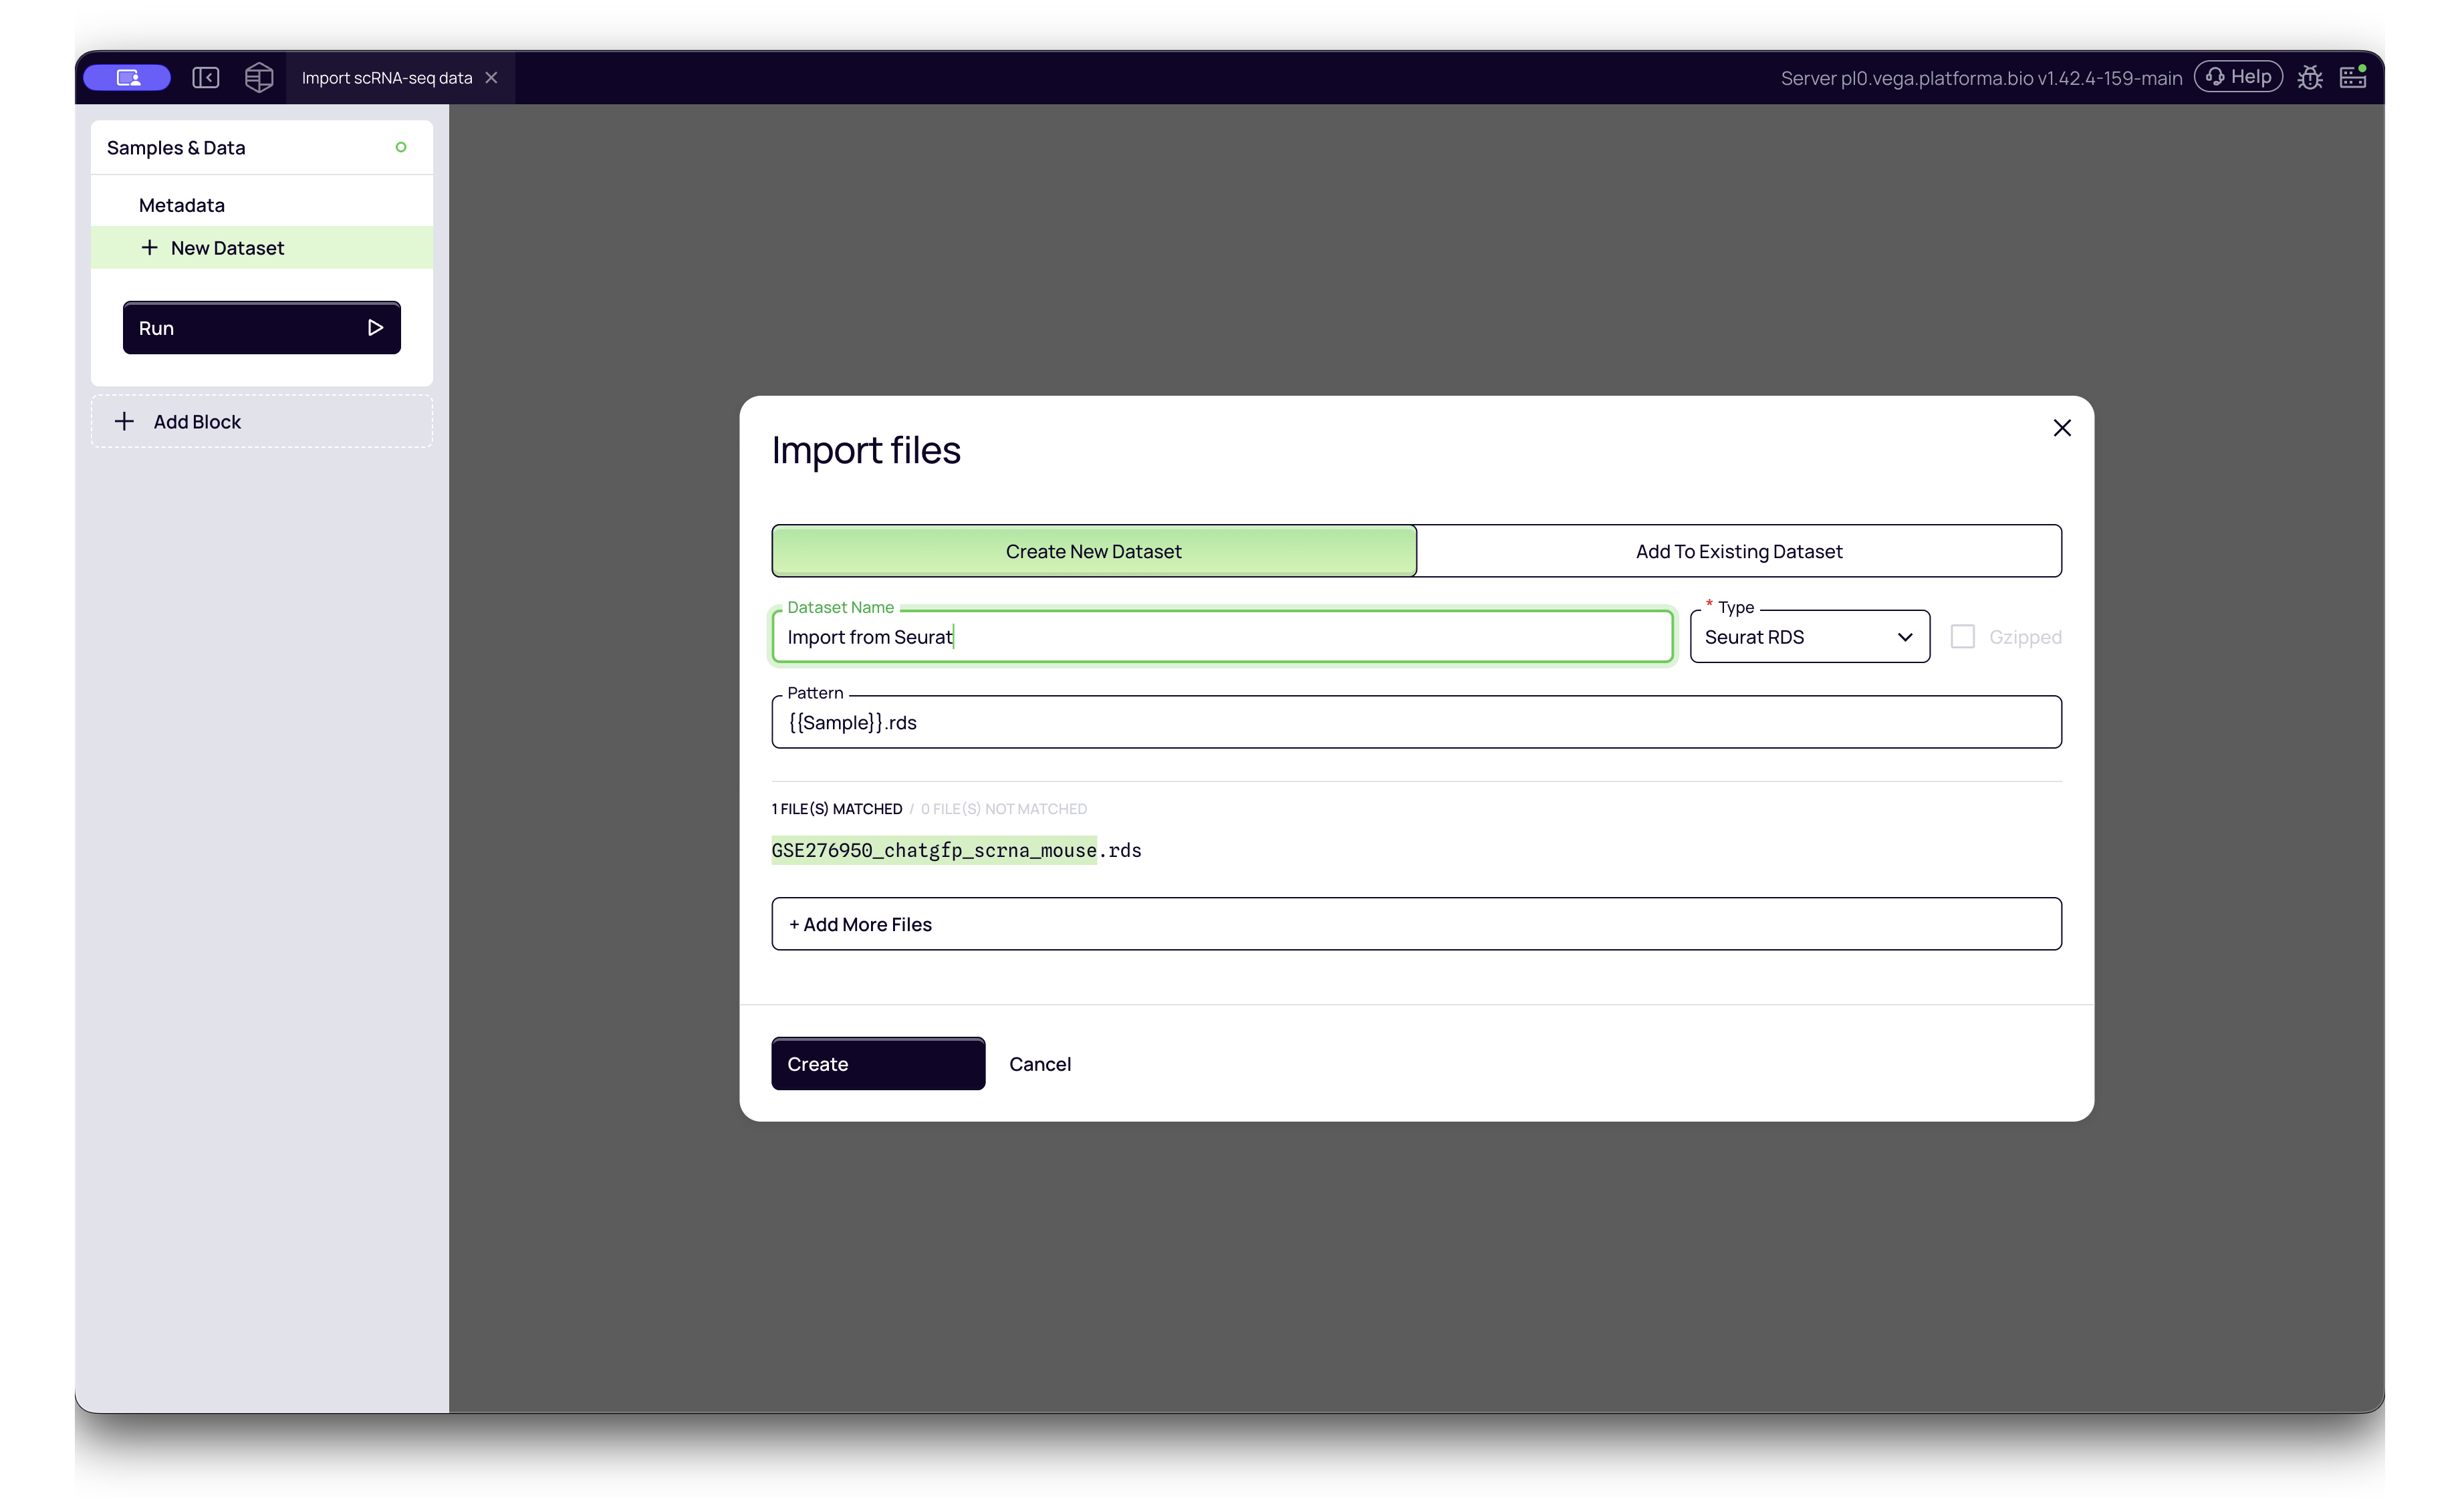
4. Seurat Objects (.rds)
If your data was processed in R using Seurat, you can directly import the saved R object.
- Platforma Type:
Seurat RDS - How to import: Select your
.rdsfile. Platforma will extract the counts and metadata.
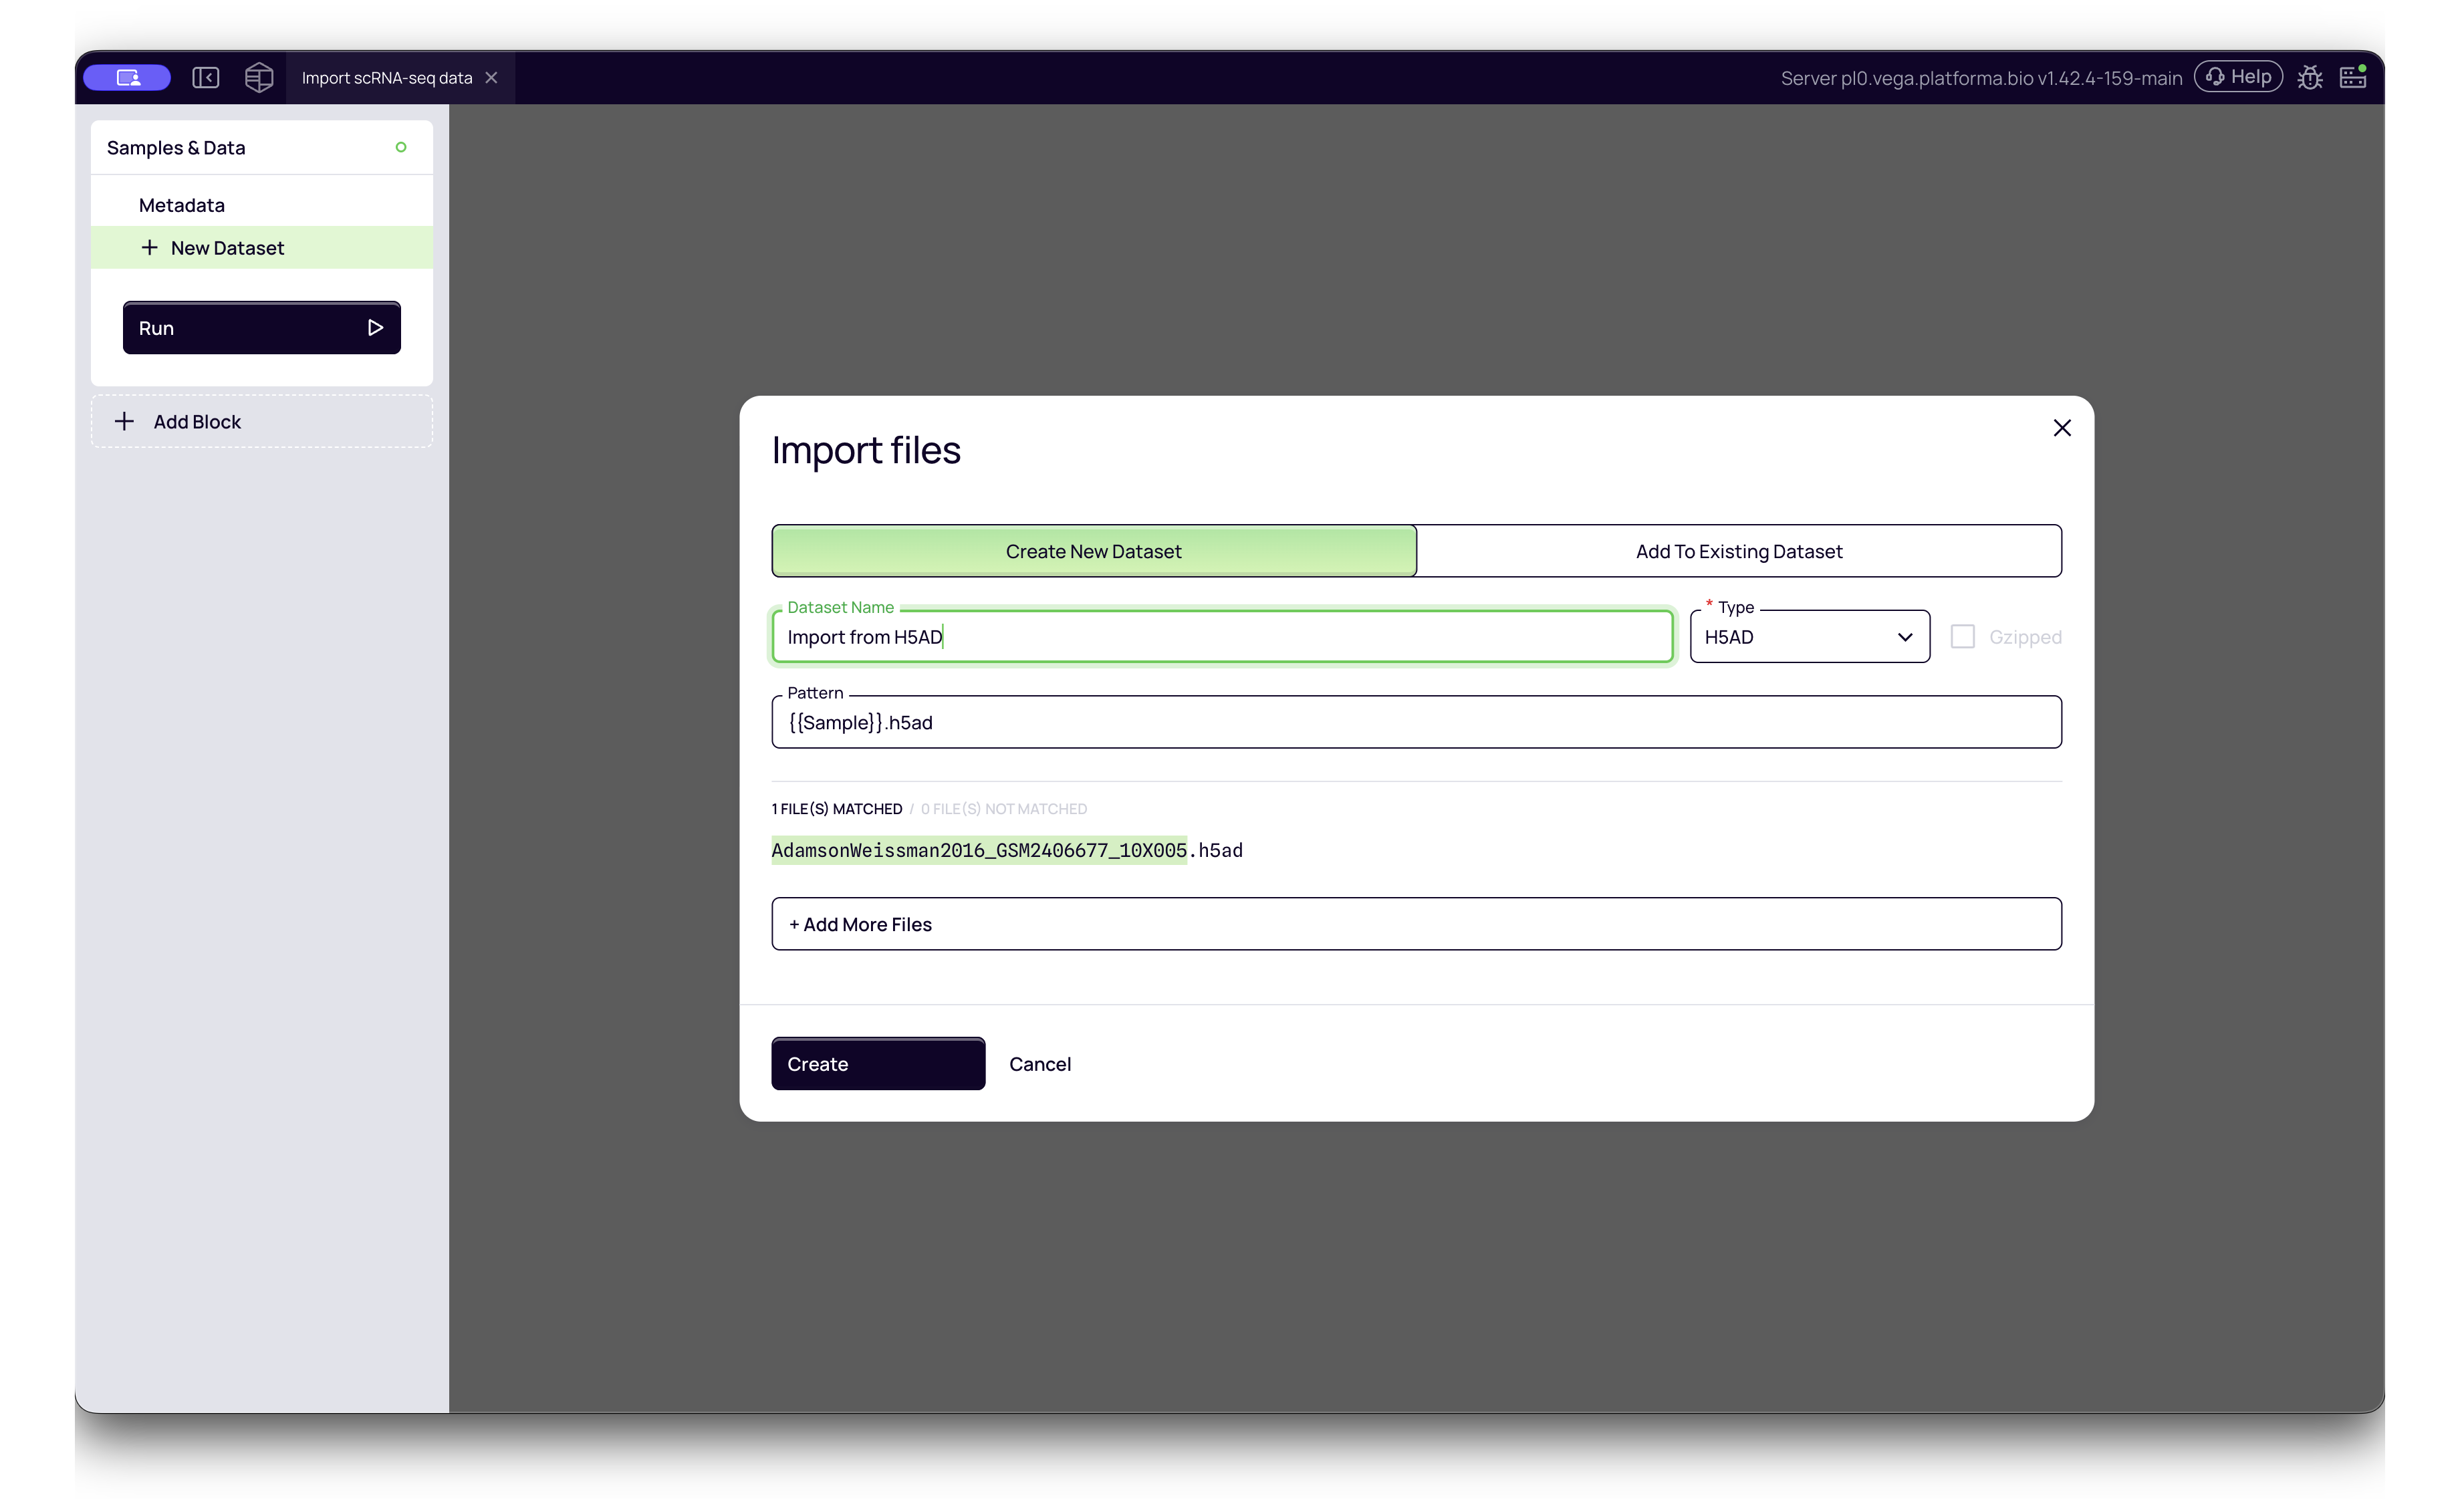
5. AnnData (.h5ad)
This is the standard format for Python-based analysis (e.g., Scanpy). Platforma supports both single-sample and multi-sample AnnData objects.
- Single Sample H5AD:
- Platforma Type:
H5AD - Use this for standard files containing data for one biological sample.
- Platforma Type:
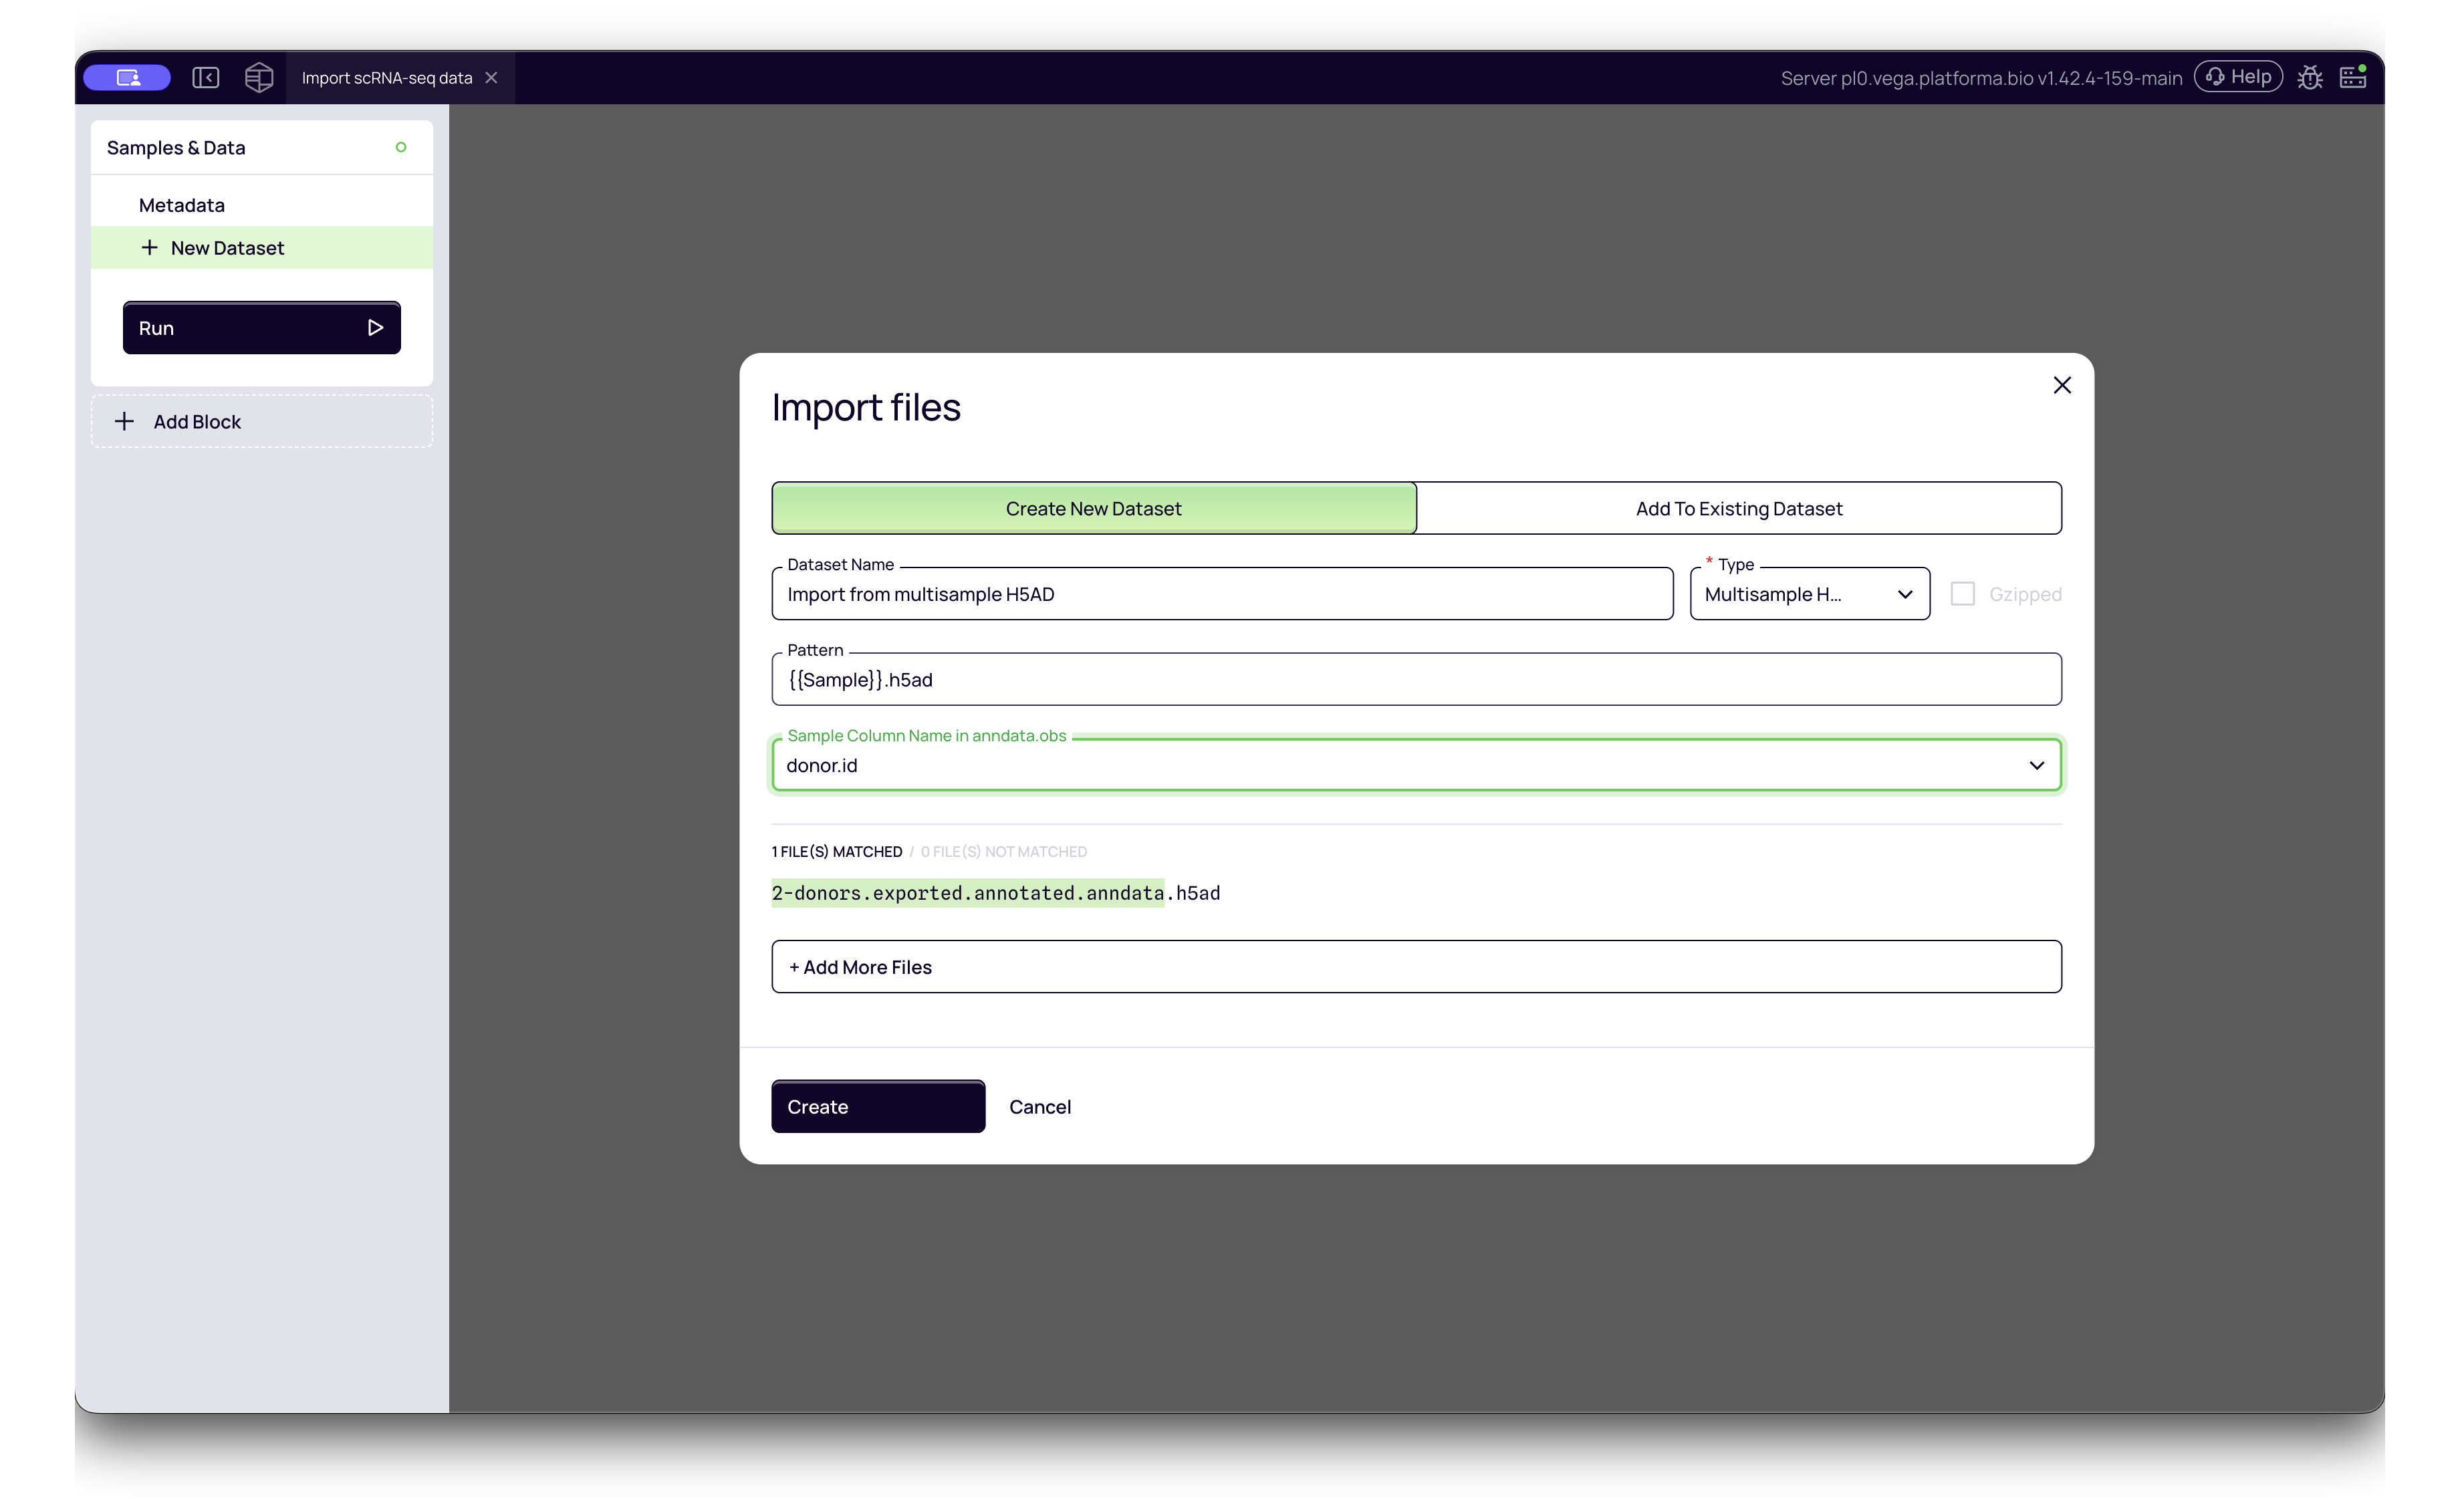
- Multi-Sample H5AD:
- Platforma Type:
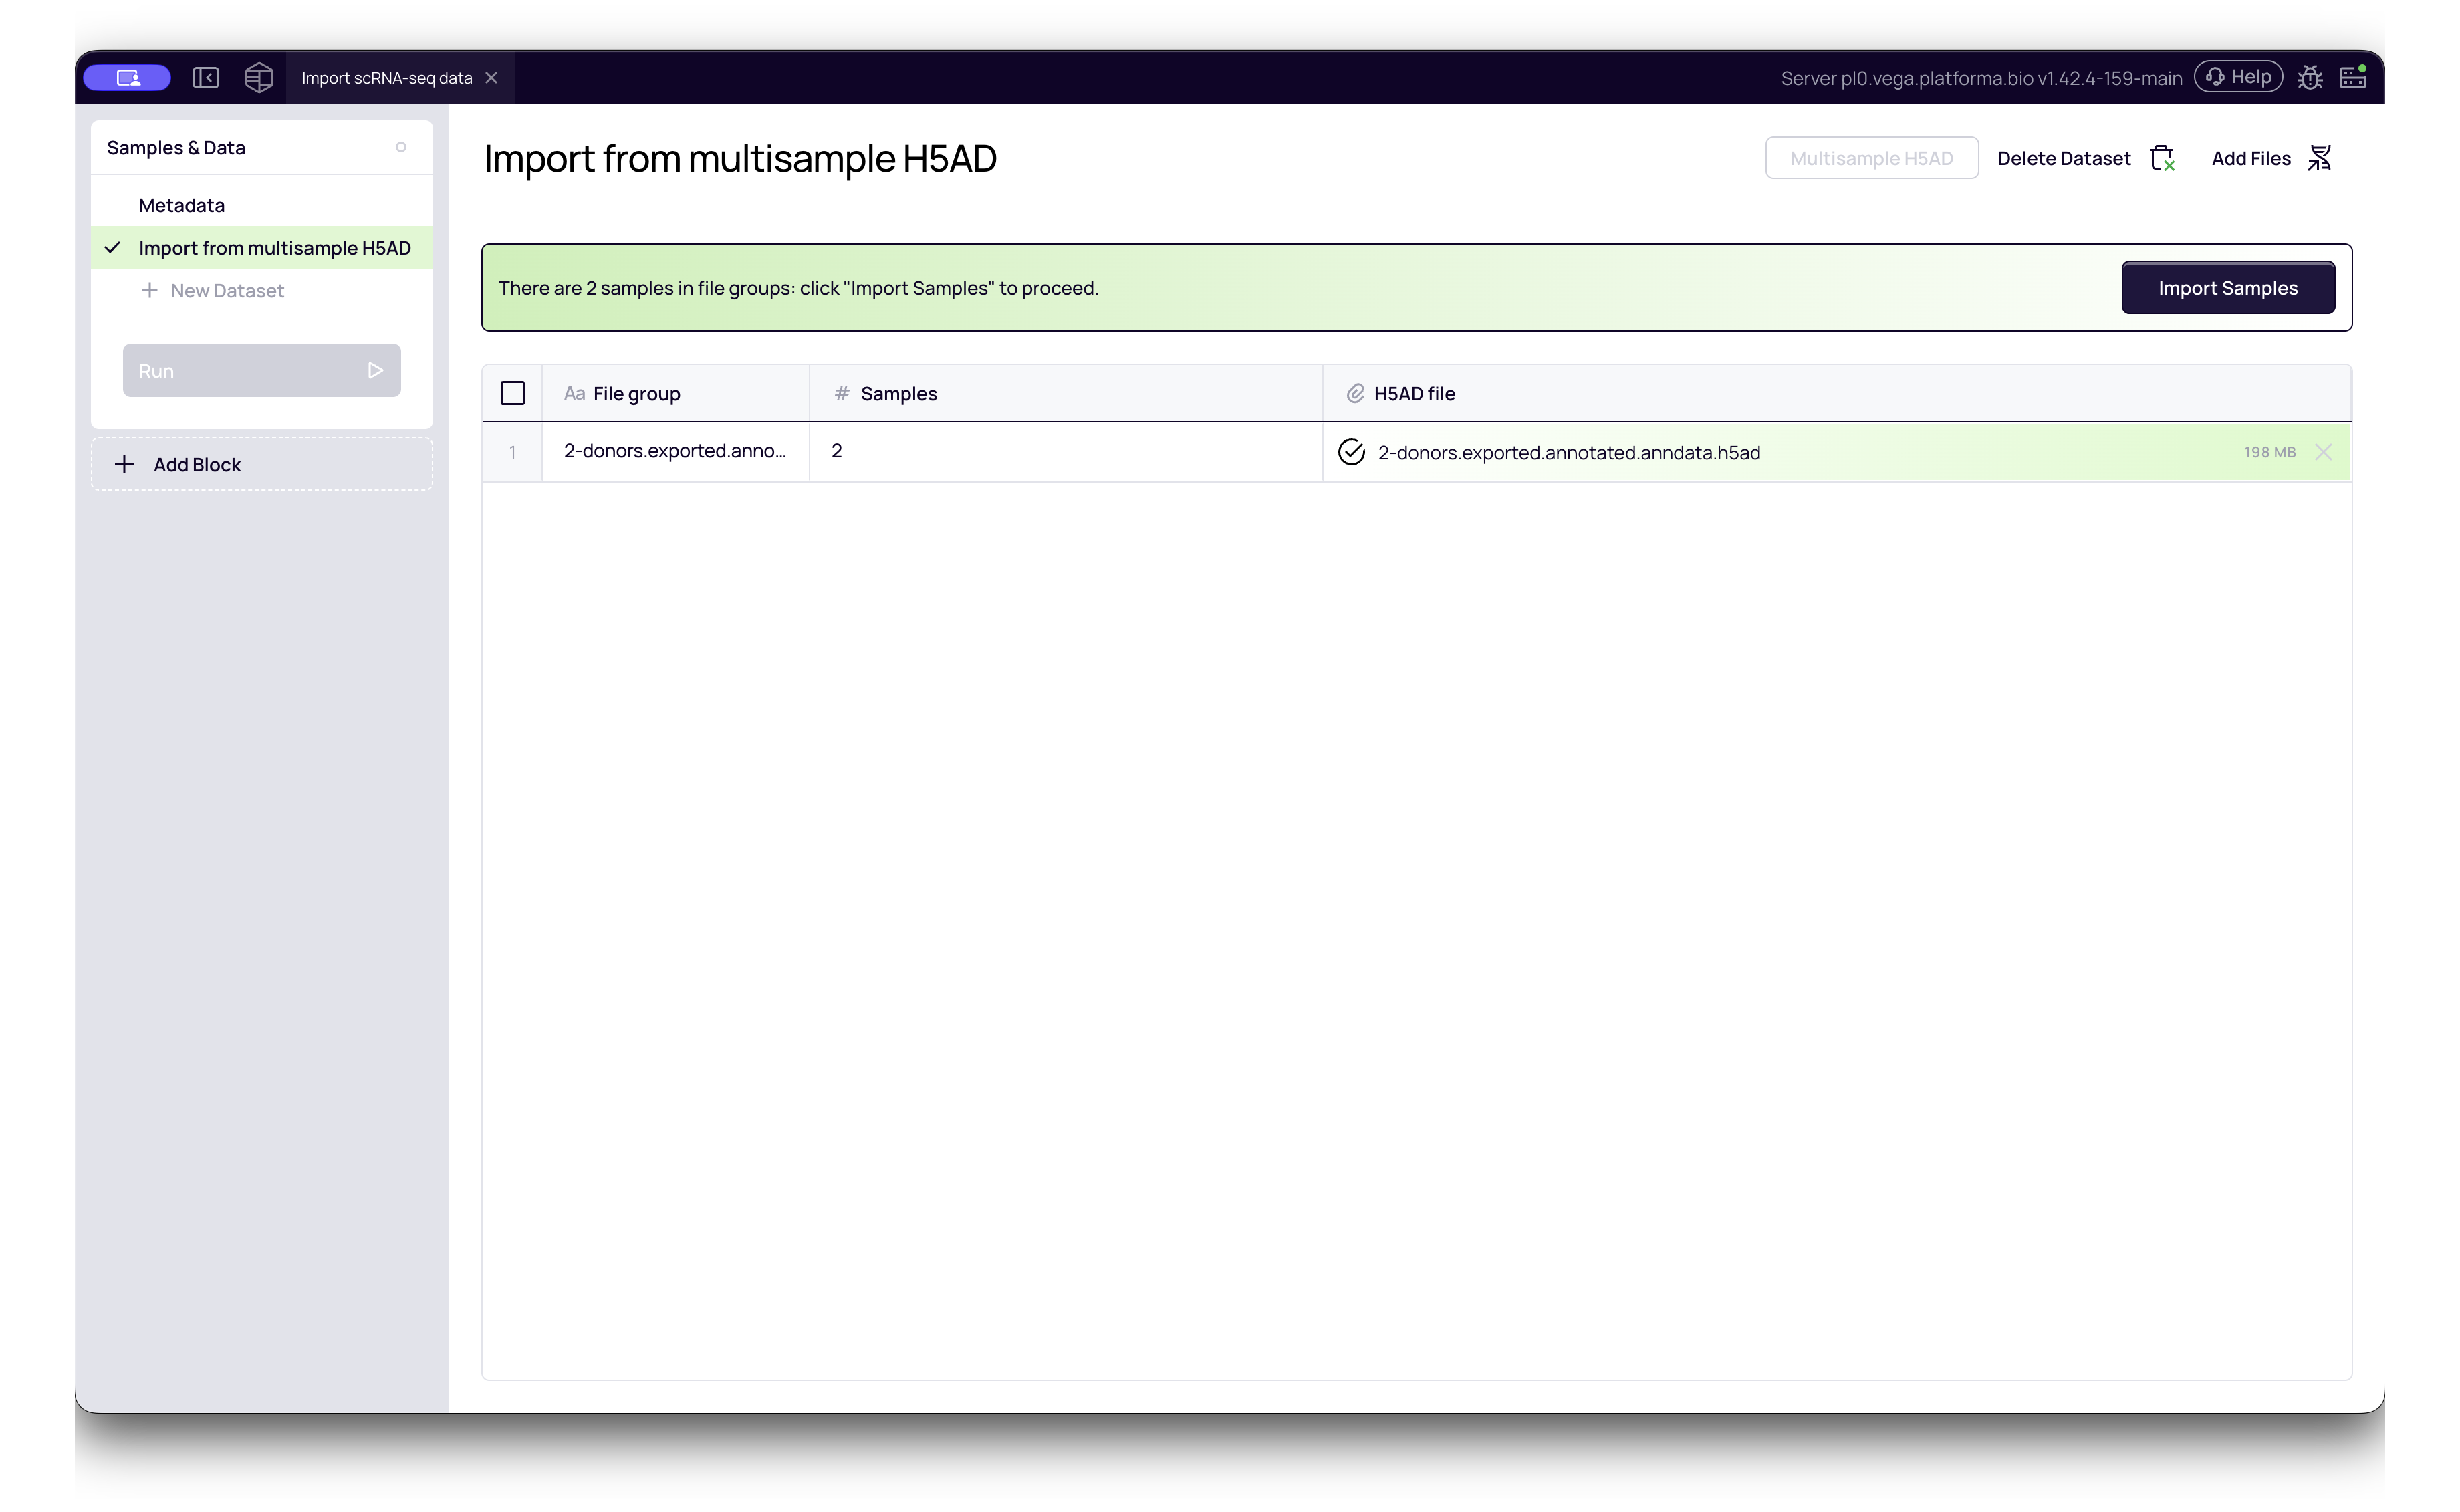
Multisample H5AD - Configuration: This format requires an extra step. After selecting the file, Platforma will parse the header. You must then select the Sample Column Name from a dropdown menu (e.g.,
donor_id,batch,sample). This tells Platforma how to split the file into individual samples for analysis.
- Platforma Type:
Standardizing Data for Analysis
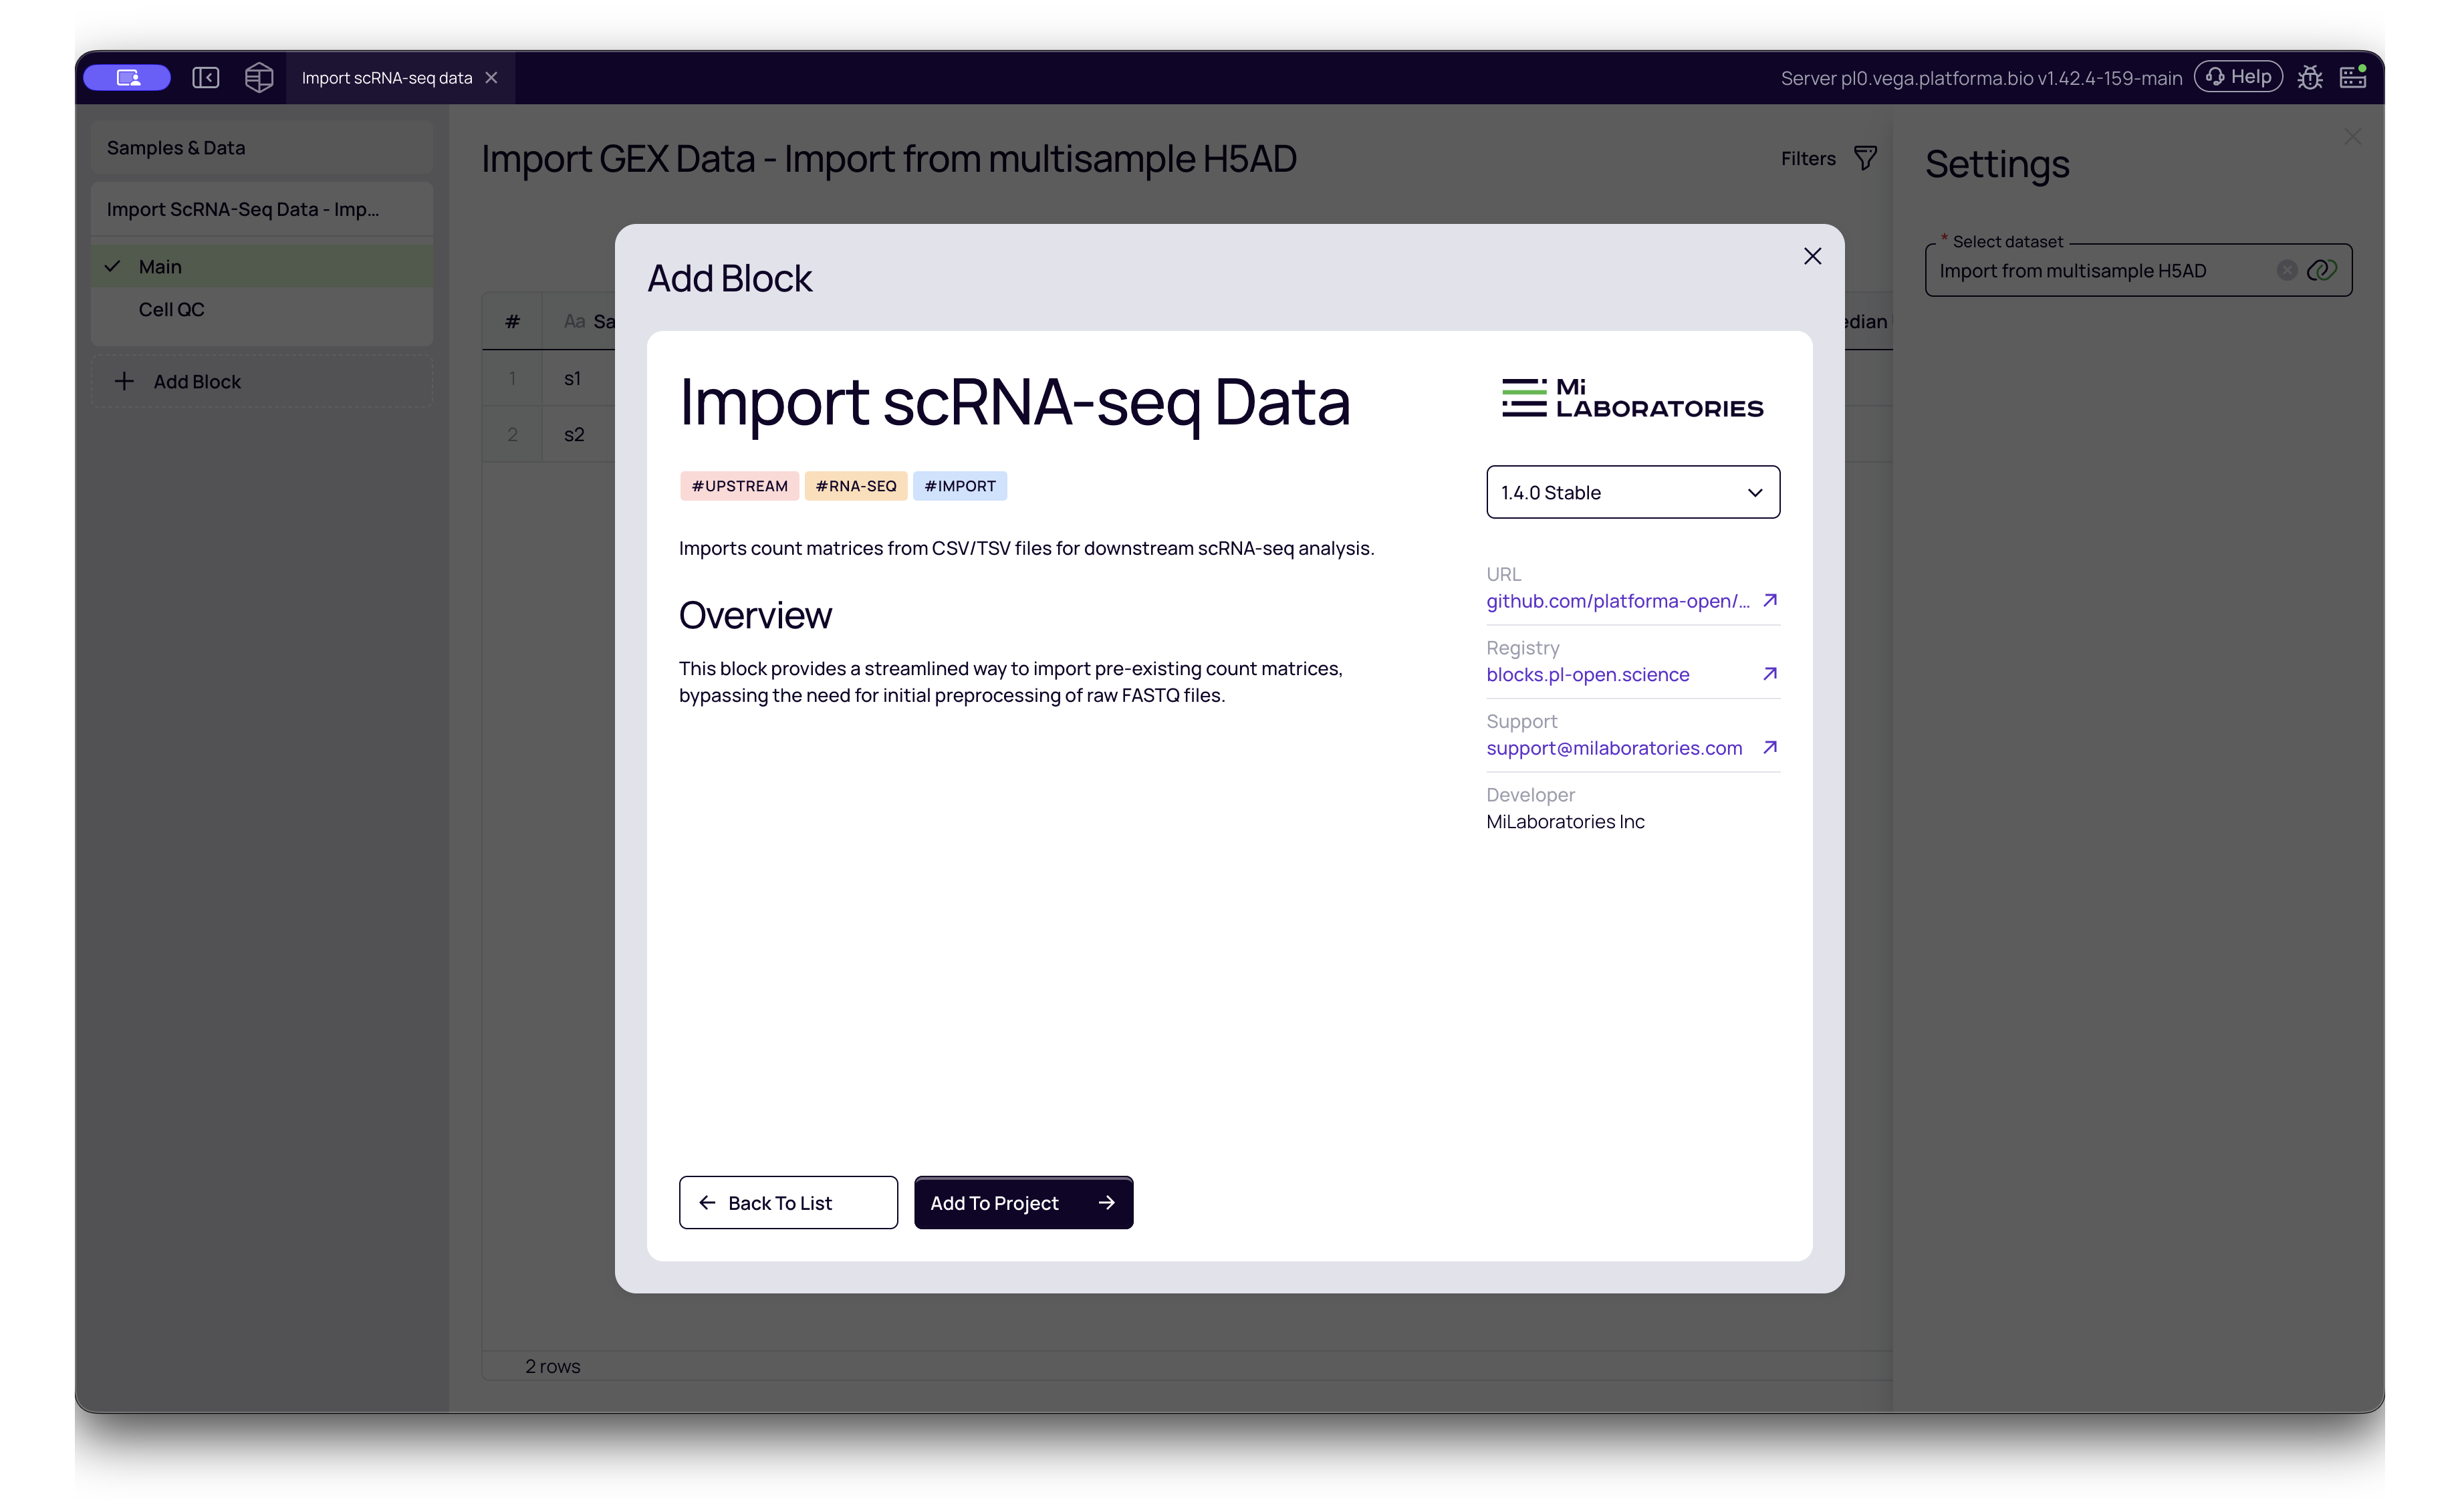
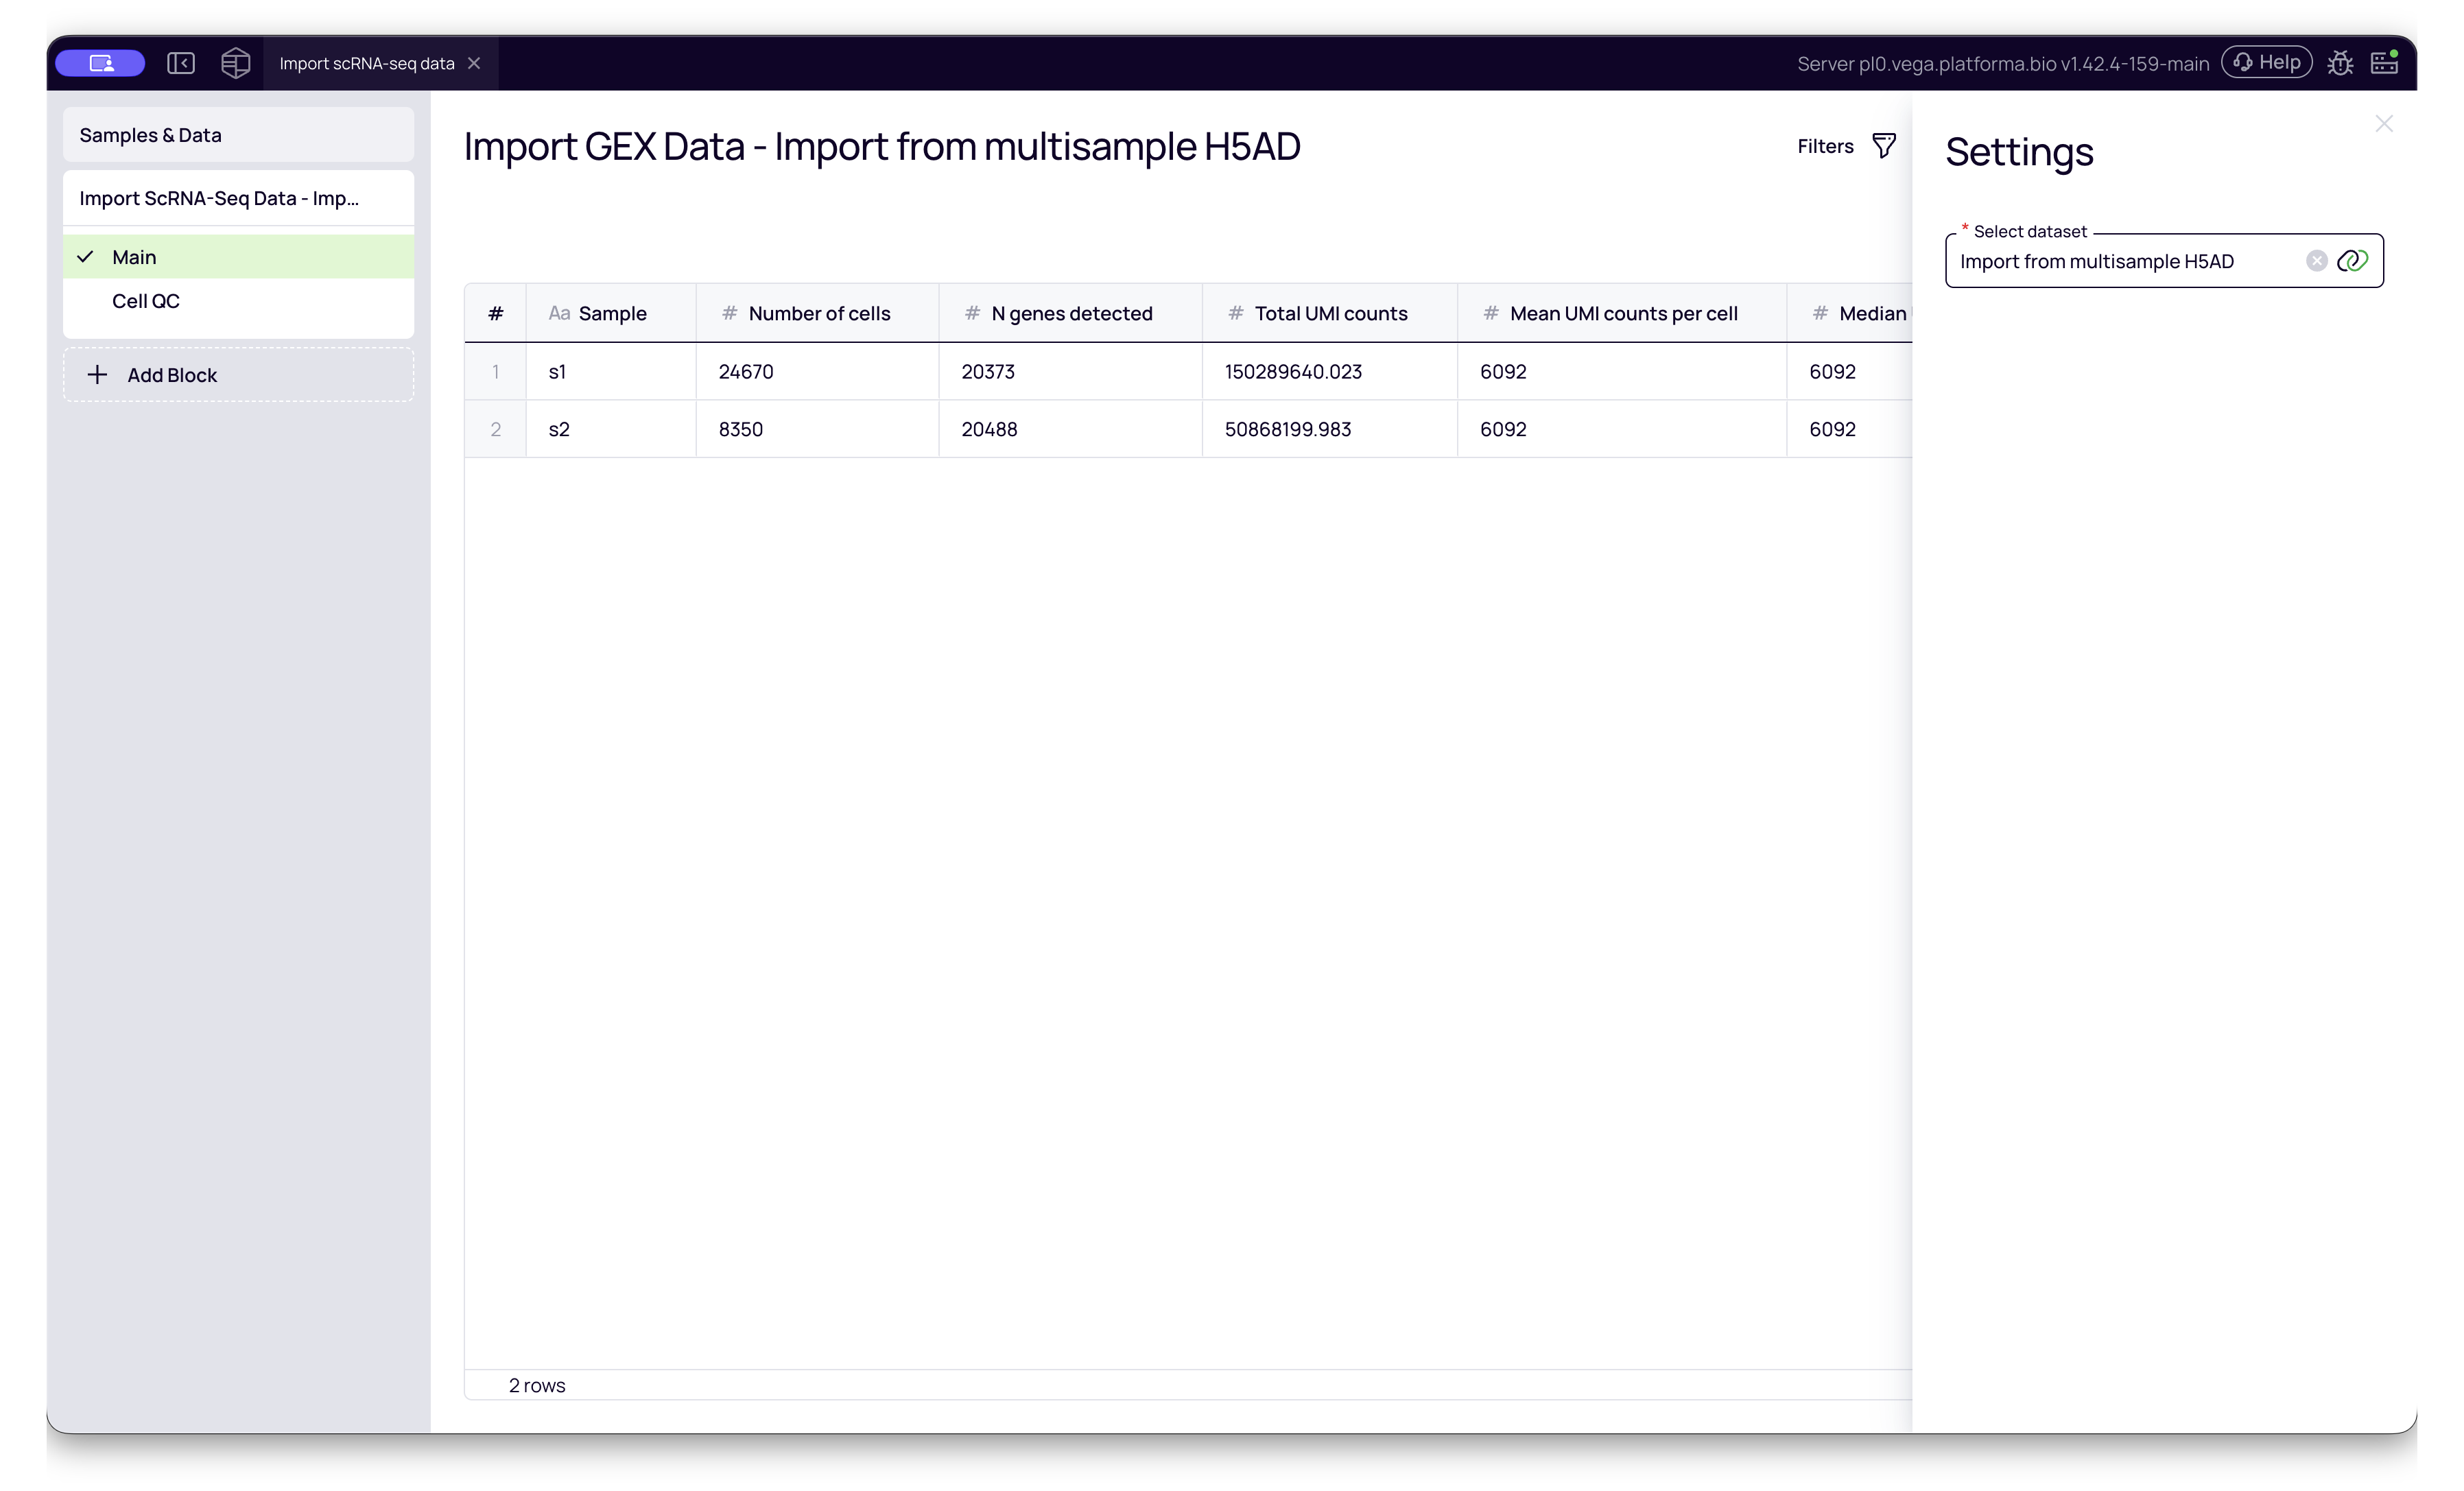
Once your files are uploaded to the Samples & Data block, they are stored as raw datasets. To prepare them for downstream analysis (like Dimensionality Reduction or Clustering), you must add the Import scRNA-seq Data block to your pipeline.
- Add the Block: Search for "Import scRNA-seq Data" in the block library.
- Select Dataset: Choose the dataset you just created (e.g., "Import from Seurat").
- Run: This block will convert the various input formats (CSV, H5AD, RDS, etc.) into Platforma's standardized internal format.
Interpreting Cell QC Metrics
After the Import scRNA-seq Data block finishes running, it generates a Cell QC report. This report is crucial for verifying that your imported data is high quality before you proceed with analysis.
To access it, click the Cell QC tab on the left side of the block results.
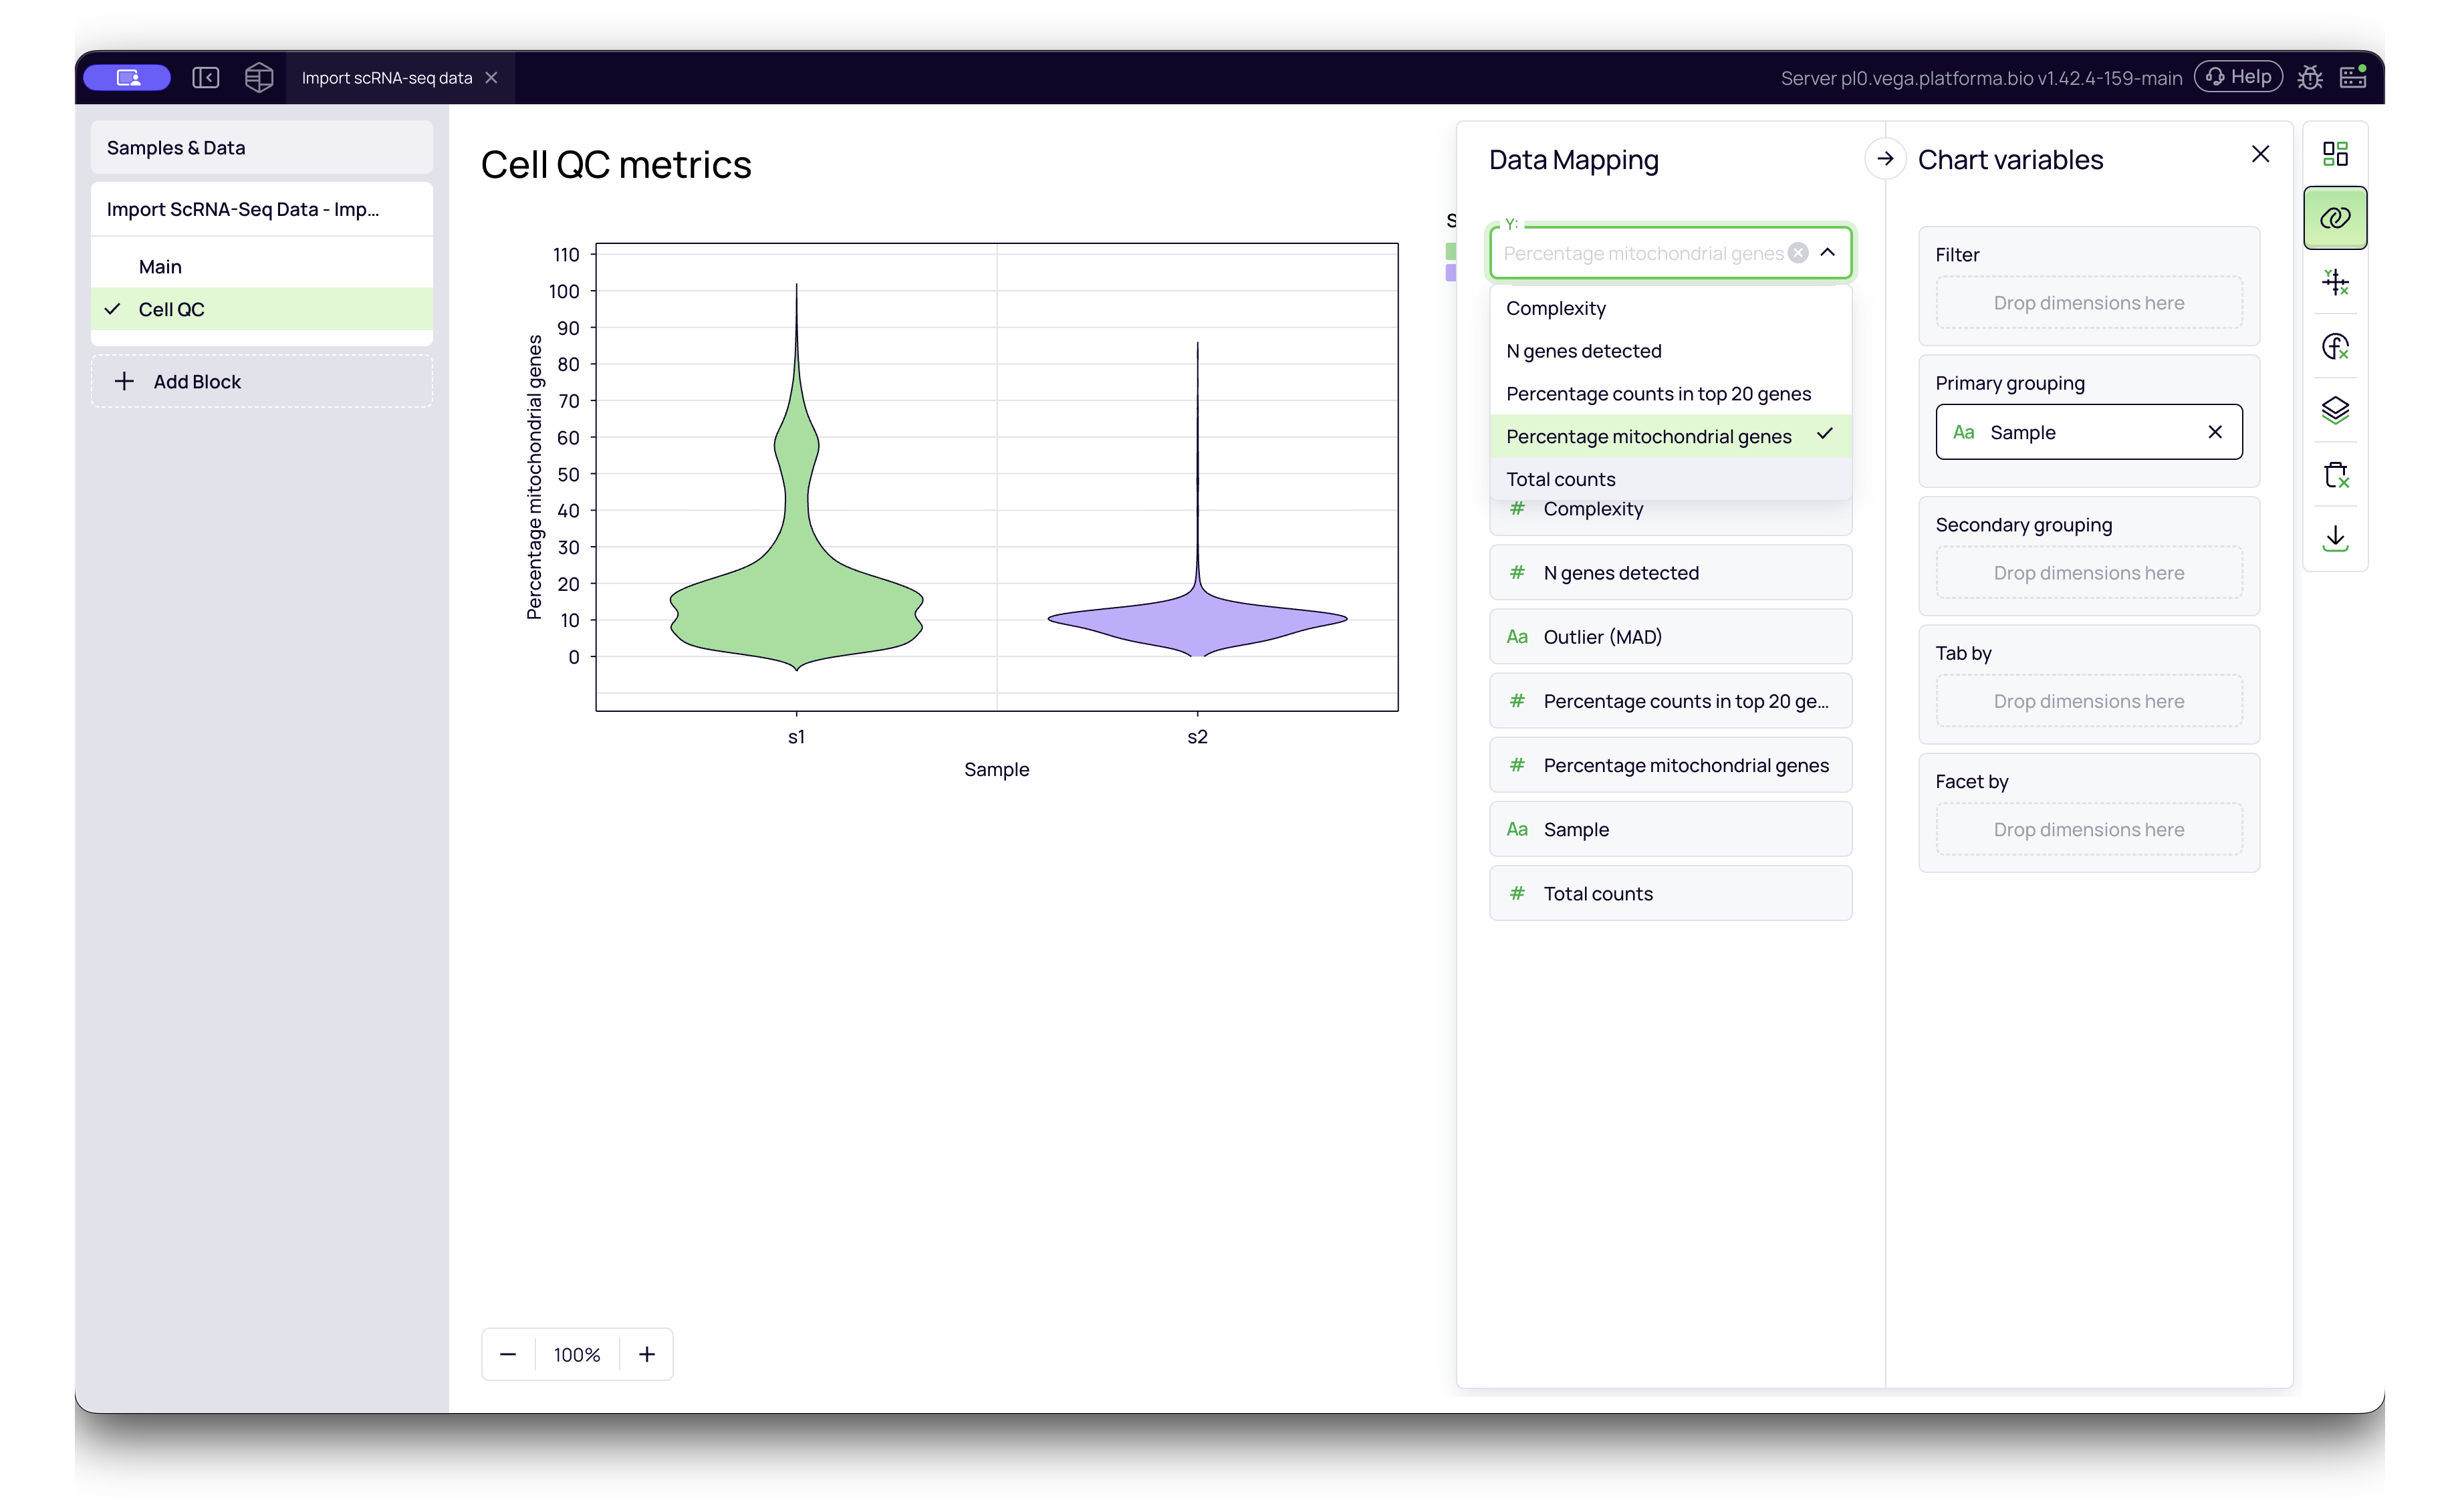
The interactive violin plots allow you to visualize the distribution of quality metrics across your samples. You can select different metrics from the Y-axis dropdown menu:
- Percentage counts in top 20 genes: Measures library complexity. If a large percentage of reads comes from only a few genes (e.g., >20-30%), it may indicate low complexity or stressed cells.
- Percentage mitochondrial genes: A high percentage often indicates damaged or dying cells (where cytoplasmic RNA has leaked out, leaving only mitochondrial RNA). A common threshold for filtering is >10-20%.
- N genes detected: The number of unique genes found in each cell. Very low numbers suggest empty droplets or low-quality cells; extremely high numbers might indicate doublets (two cells stuck together).
- Total counts: The total number of reads/UMIs per cell. This correlates with sequencing depth.
This report confirms your data was imported correctly and helps you spot outlier samples immediately. After this step, your pre-processed data behaves exactly like data processed from FASTQ files, allowing you to proceed immediately to Dimensionality Reduction, Clustering etc.