Cluster Markers (DEGs)
In the previous steps, we visualized our cells (Dimensionality Reduction) and grouped them into "clusters" (Leiden Clustering). This gave us groups named CL-0, CL-1, CL-2, etc.
But what are these cells? Are they T-cells, B-cells, or monocytes?
To give these clusters a biological identity, we must find their marker genes. This process involves asking the data, "What genes are uniquely upregulated in CL-0 compared to all other clusters?" Answering this question is the single most important step in scRNA-seq analysis.
The Cluster Markers block performs this differential expression analysis for you, providing a list of marker genes that define each cluster.
Project Setup
This tutorial assumes you have already successfully run the Leiden Clustering block. The Cluster Markers block will use the cluster labels from that block as its primary input.
Finding Cluster Markers
Adding the Block
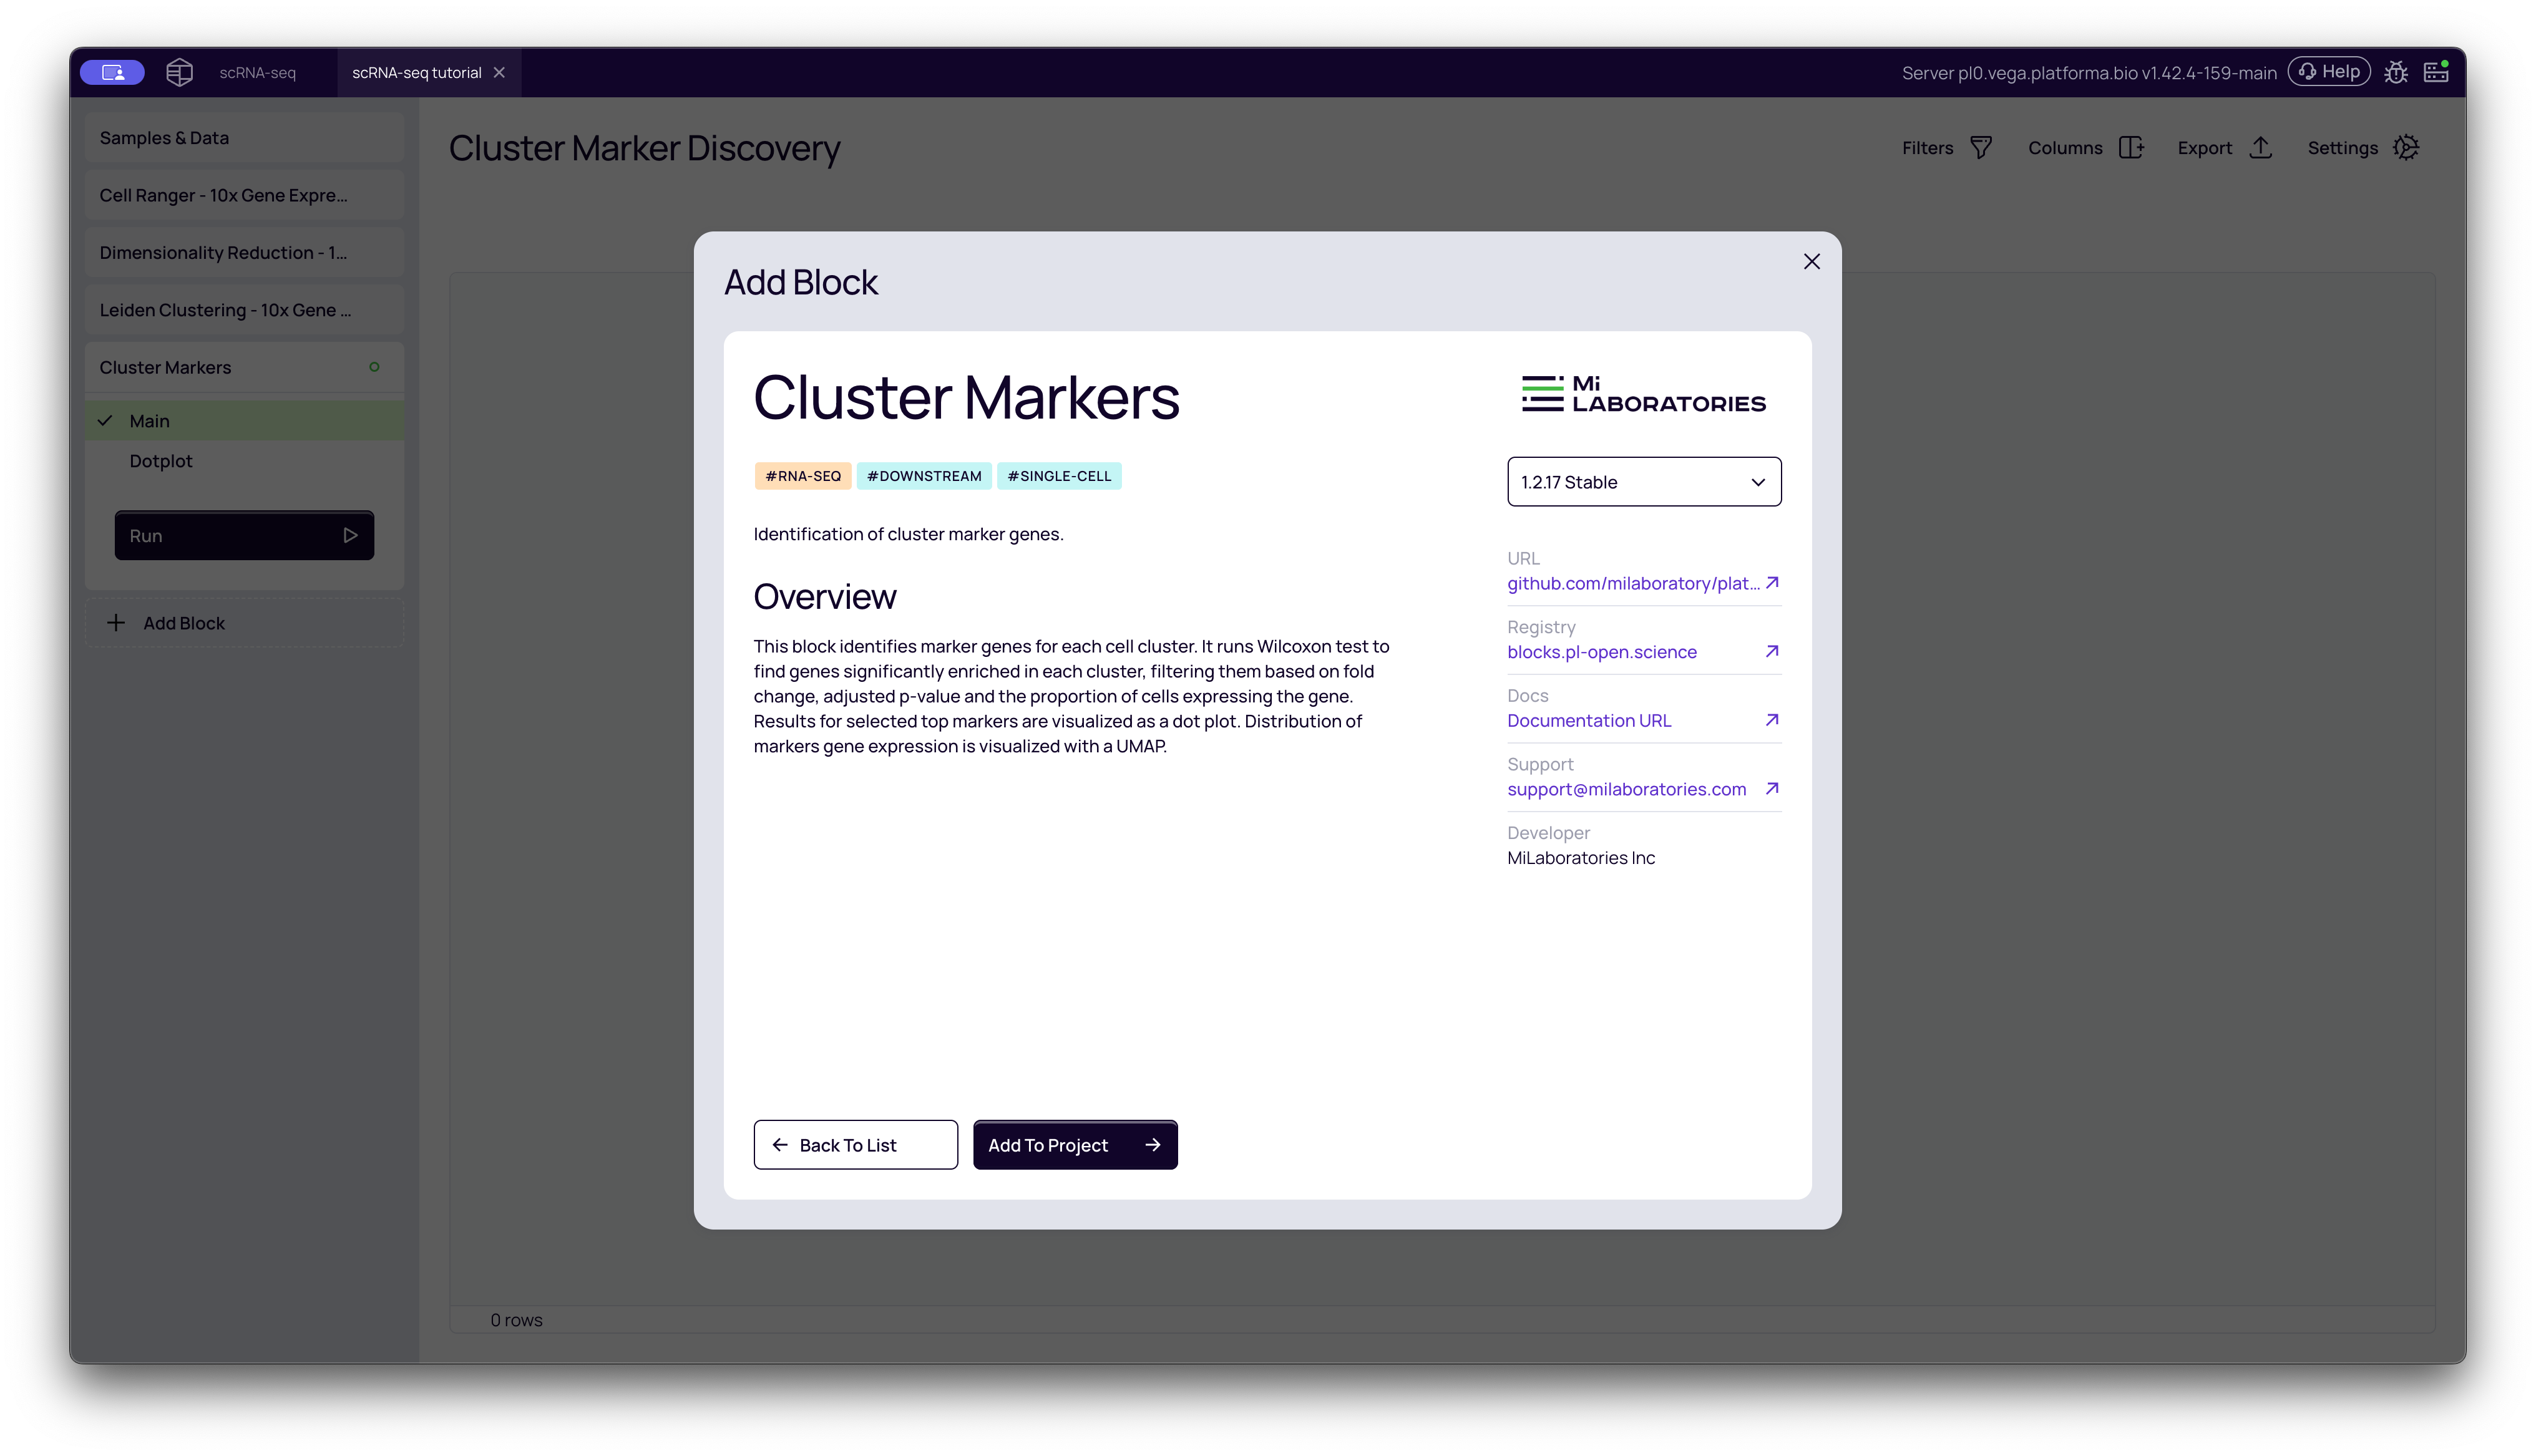
- From your project pipeline, click the Add Block button.
- Use the search bar to find and select the Cluster Markers analysis block.
- Click Add to Project to add it to your analysis pipeline.
Configuring the Analysis
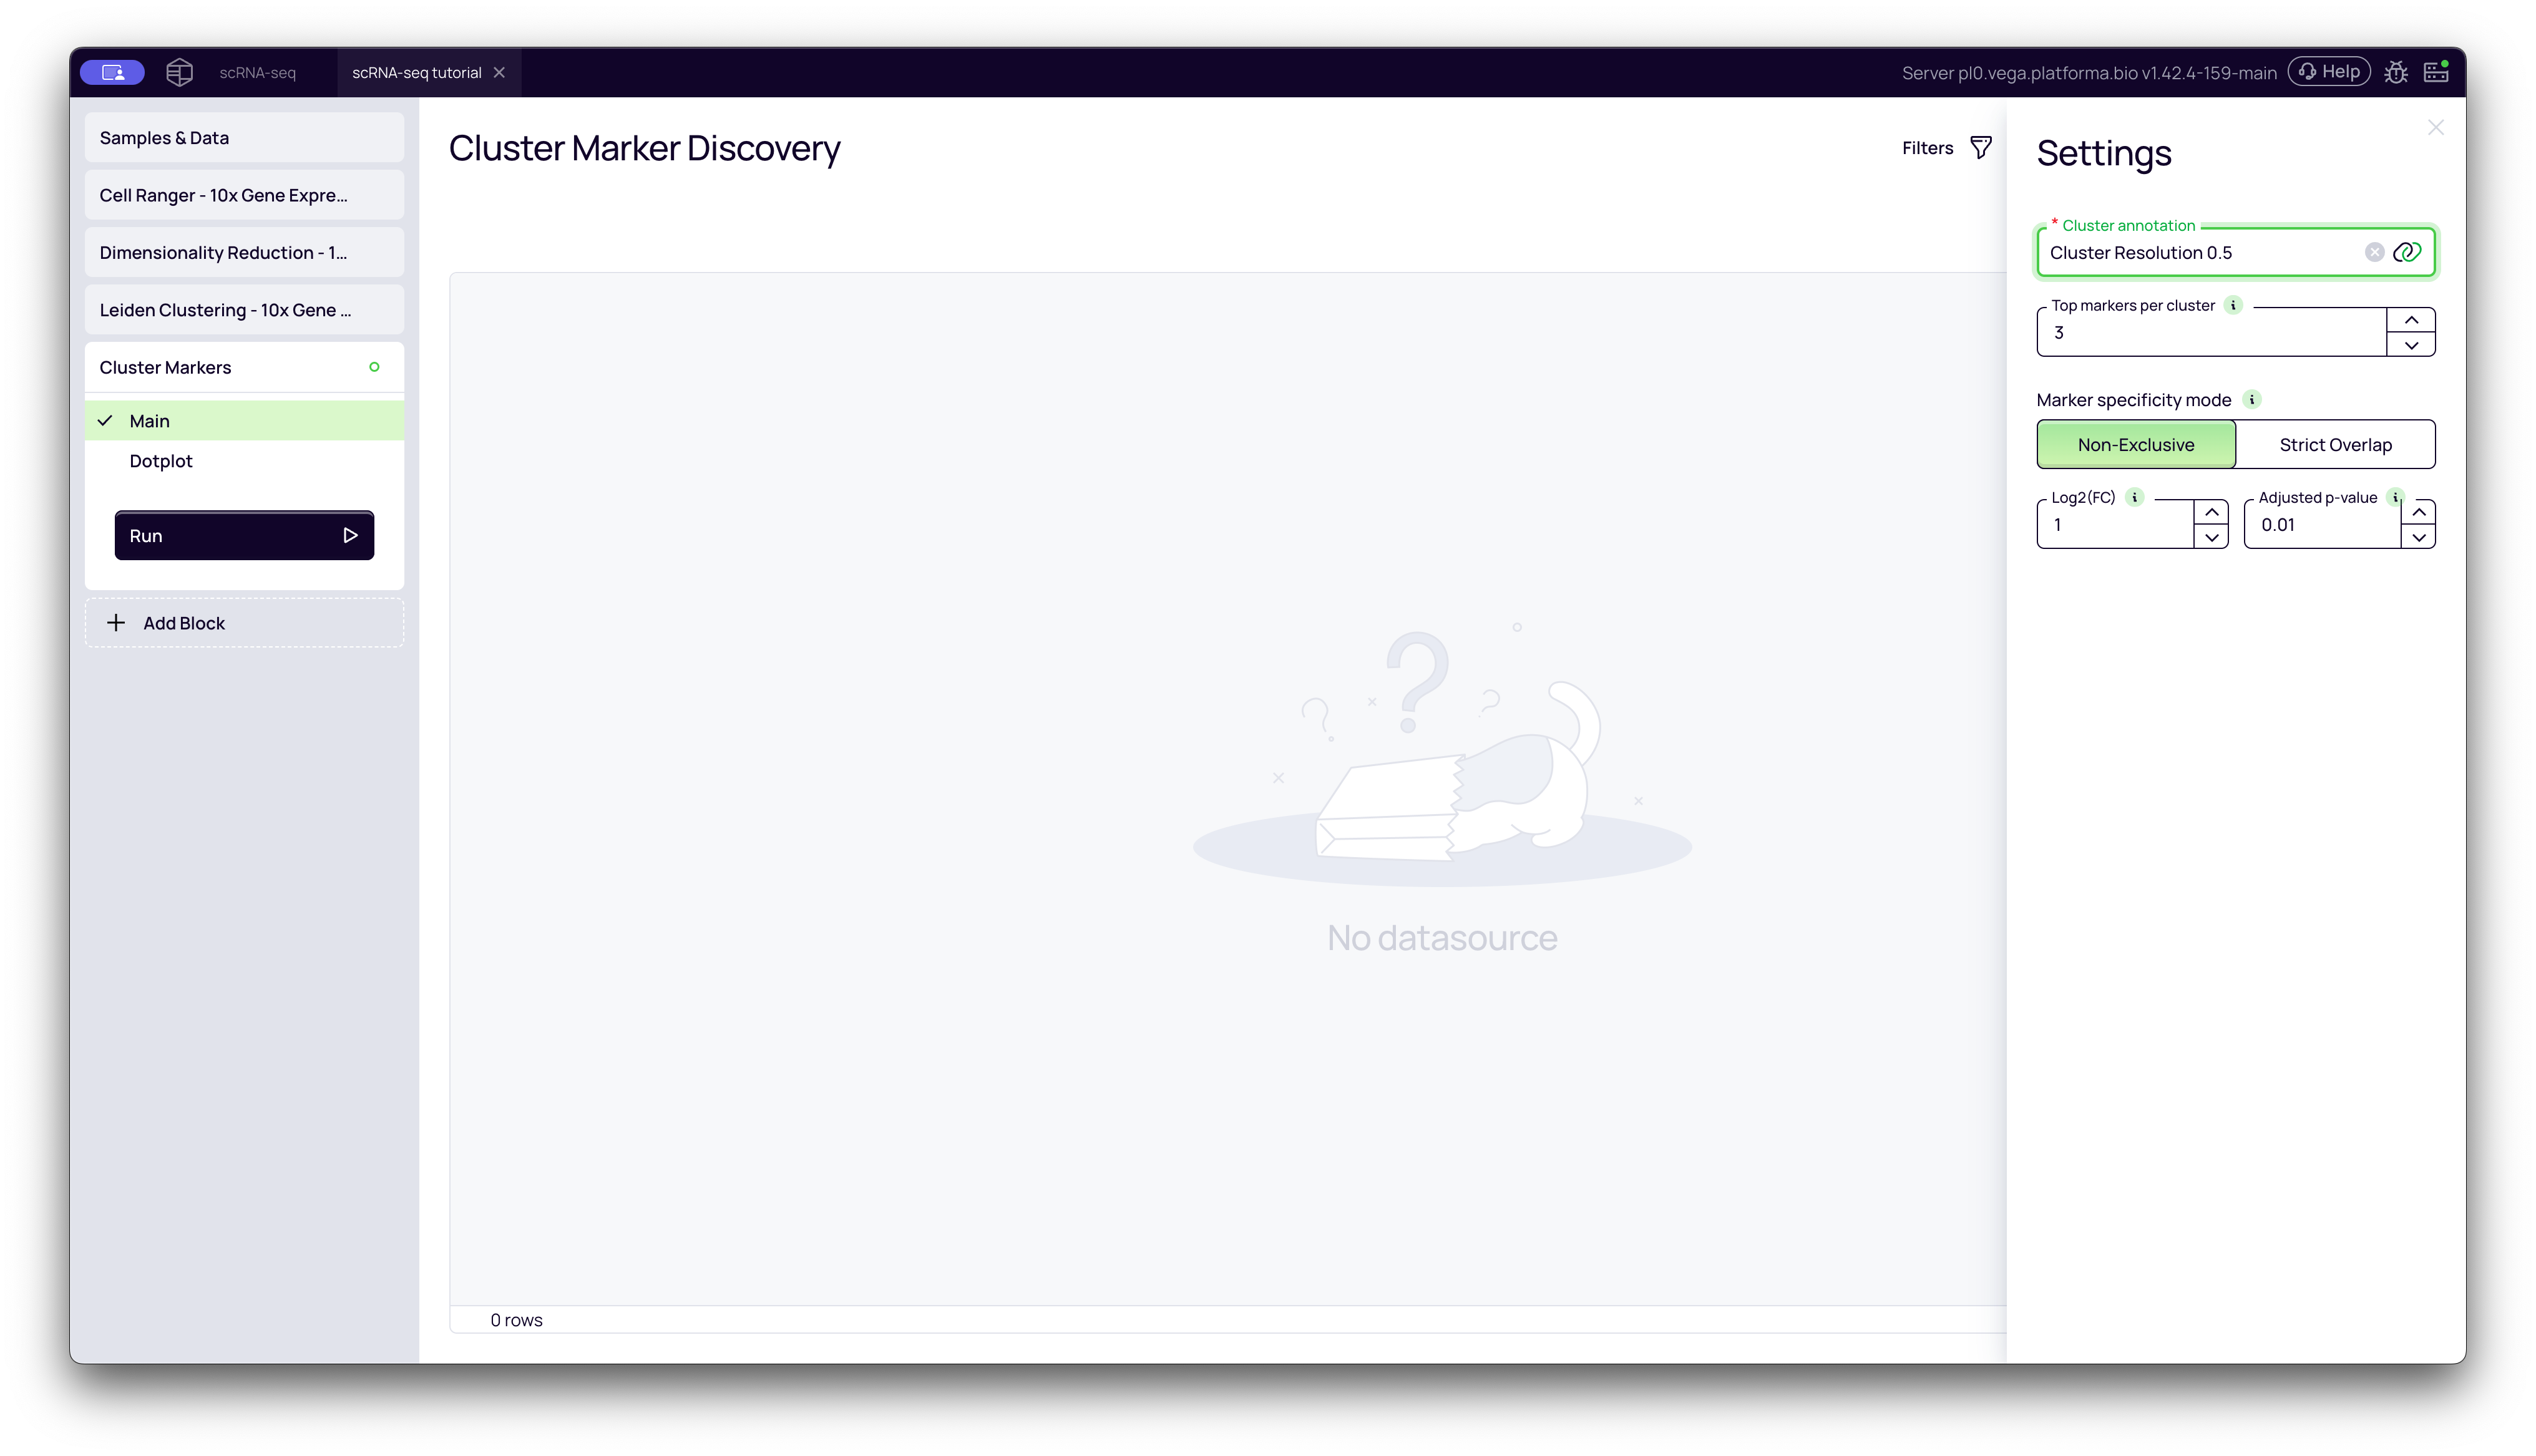
Once the block is added, you need to configure its settings in the right-hand panel.
-
Cluster annotation: Select the output from your upstream Leiden Clustering block (e.g., "Cluster Resolution 0.5"). This tells the block which clustering results to use.
-
Top markers per cluster: This is a visualization setting that only affects the Dotplot. It controls how many of the top-ranking genes to display. It does not affect the main results table.
- Note: A good value is 3-10. Start with 5 to get a good overview of what defines each cluster.
-
Marker specificity mode: This is the most important setting. It controls the strategy for finding markers.
| Mode | What It Does | When to Use It |
|---|---|---|
| Non-exclusive (Default) | Finds all genes that are significantly upregulated in more than 20% of cells in one cluster compared to all other clusters. A gene can be a marker for multiple clusters if it's highly expressed in all of them (e.g., a general "immune cell" gene). | This is a great "first pass" to understand the general biology of each cluster. |
| Strict Overlap | Finds genes that are uniquely upregulated in more that 20% of cells in only one cluster. It adds a second rule: the gene must not be highly expressed in more than 20% of cells in any other cluster. | Use this when you need to find "smoking gun" markers that are highly specific to a single population, which is perfect for cell type identification. |
-
Log2(FC) Threshold: (Log2 Fold Change). This is the minimum "effect size" you care about.
- What it means: A value of 1 (the default) means you are only looking for genes that are at least 2-fold more expressed in your cluster than the average. A value of 2 would mean 4-fold.
- Note:
1is a strong, common threshold. If you aren't finding many markers, you can lower this to0.5(a 1.4-fold change) or0.25(a 1.2-fold change) to find genes with more subtle differences.
-
Adjusted p-value: This is your statistical significance threshold.
- What it means: This is the probability that the observed fold change happened purely by chance.
- Note: A value bellow 0.05 is standard. This ensures that the markers you find are statistically significant.
Once you have configured the settings, click the Run button.
Interpreting the Results
The block will produce two tabs: Main and Dotplot.
The "Main" Tab: The Complete List
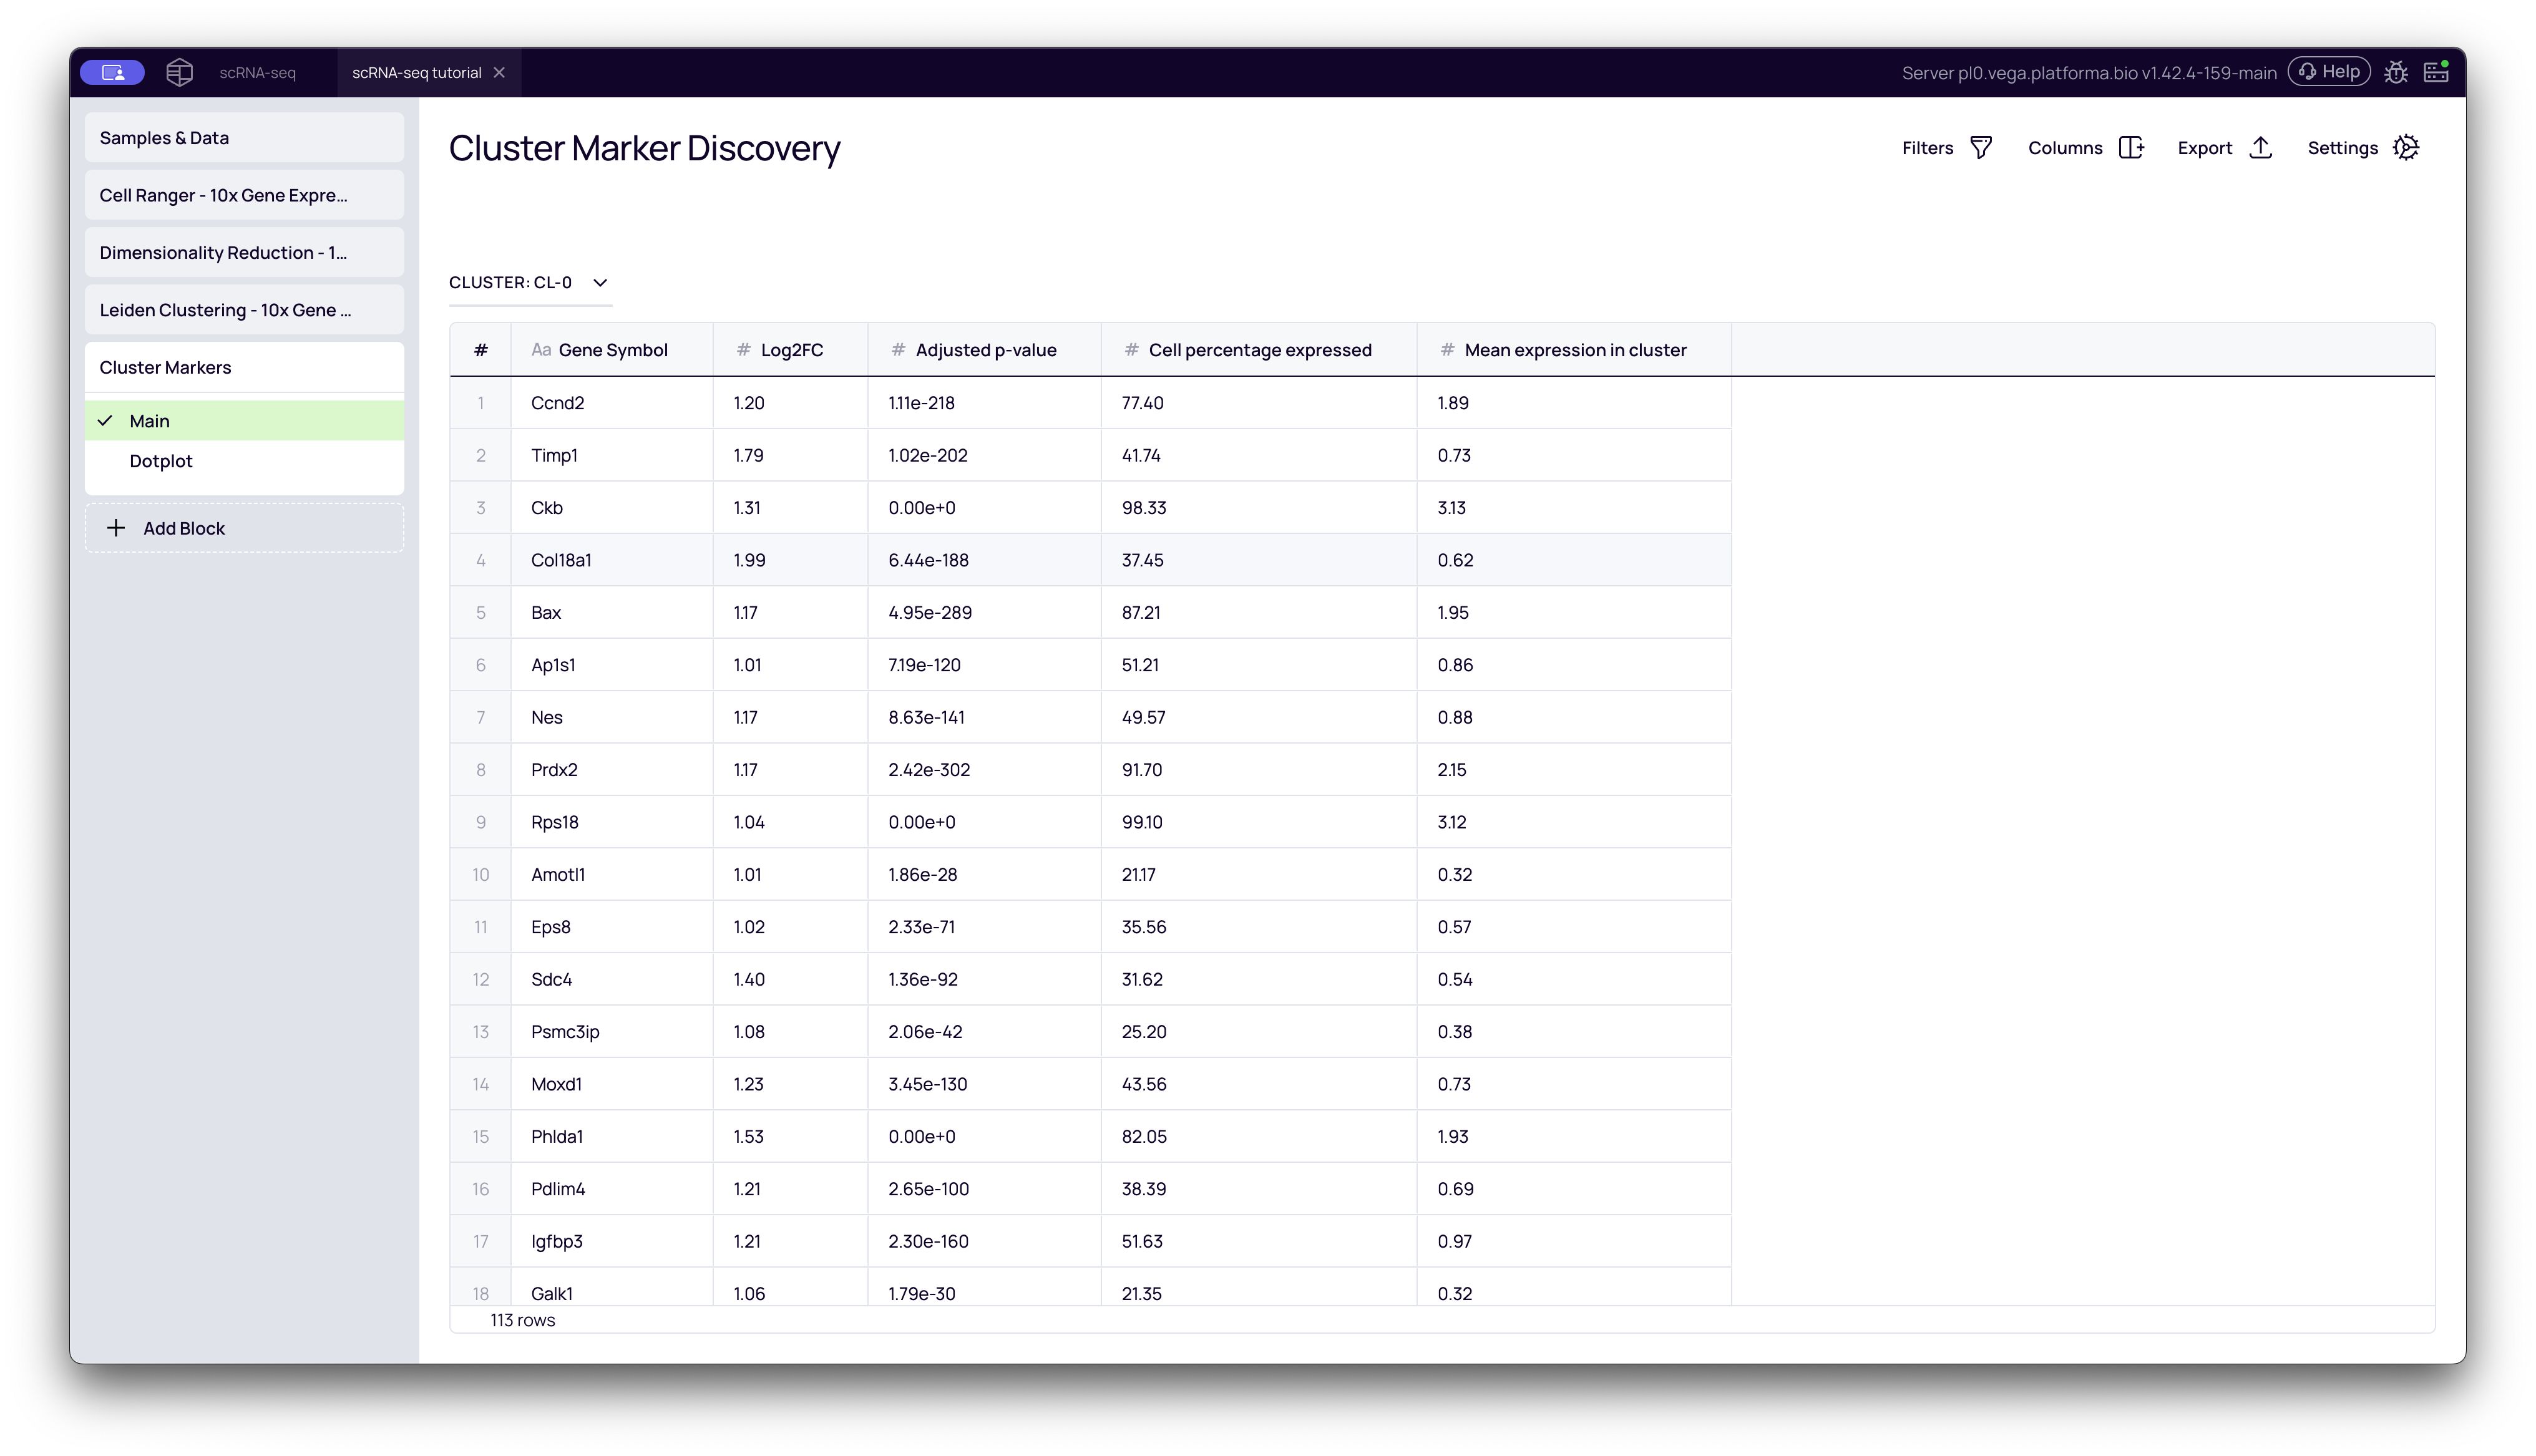
This tab contains the full, filterable table of all marker genes that passed your Log2(FC) and Adjusted p-value thresholds. This is your primary results table.
- Cluster Dropdown: At the top-left, you can select which cluster you want to inspect (e.g.,
CL-0,CL-1, etc.). - Gene Symbol: The name of the marker gene.
- Log2(FC): How strongly the gene is upregulated. Higher is more significant.
- Adjusted p-value: The statistical confidence. Lower is more significant.
- Cell percentage expressed: What percentage of cells within this cluster express this gene.
- Mean expression in cluster: The average expression level of the gene within this cluster.
How to use it: Select a cluster (e.g., CL-1), sort the table by Log2(FC) or Adjusted p-value, and look at the top genes.
The "Dotplot" Tab: The Visual Summary
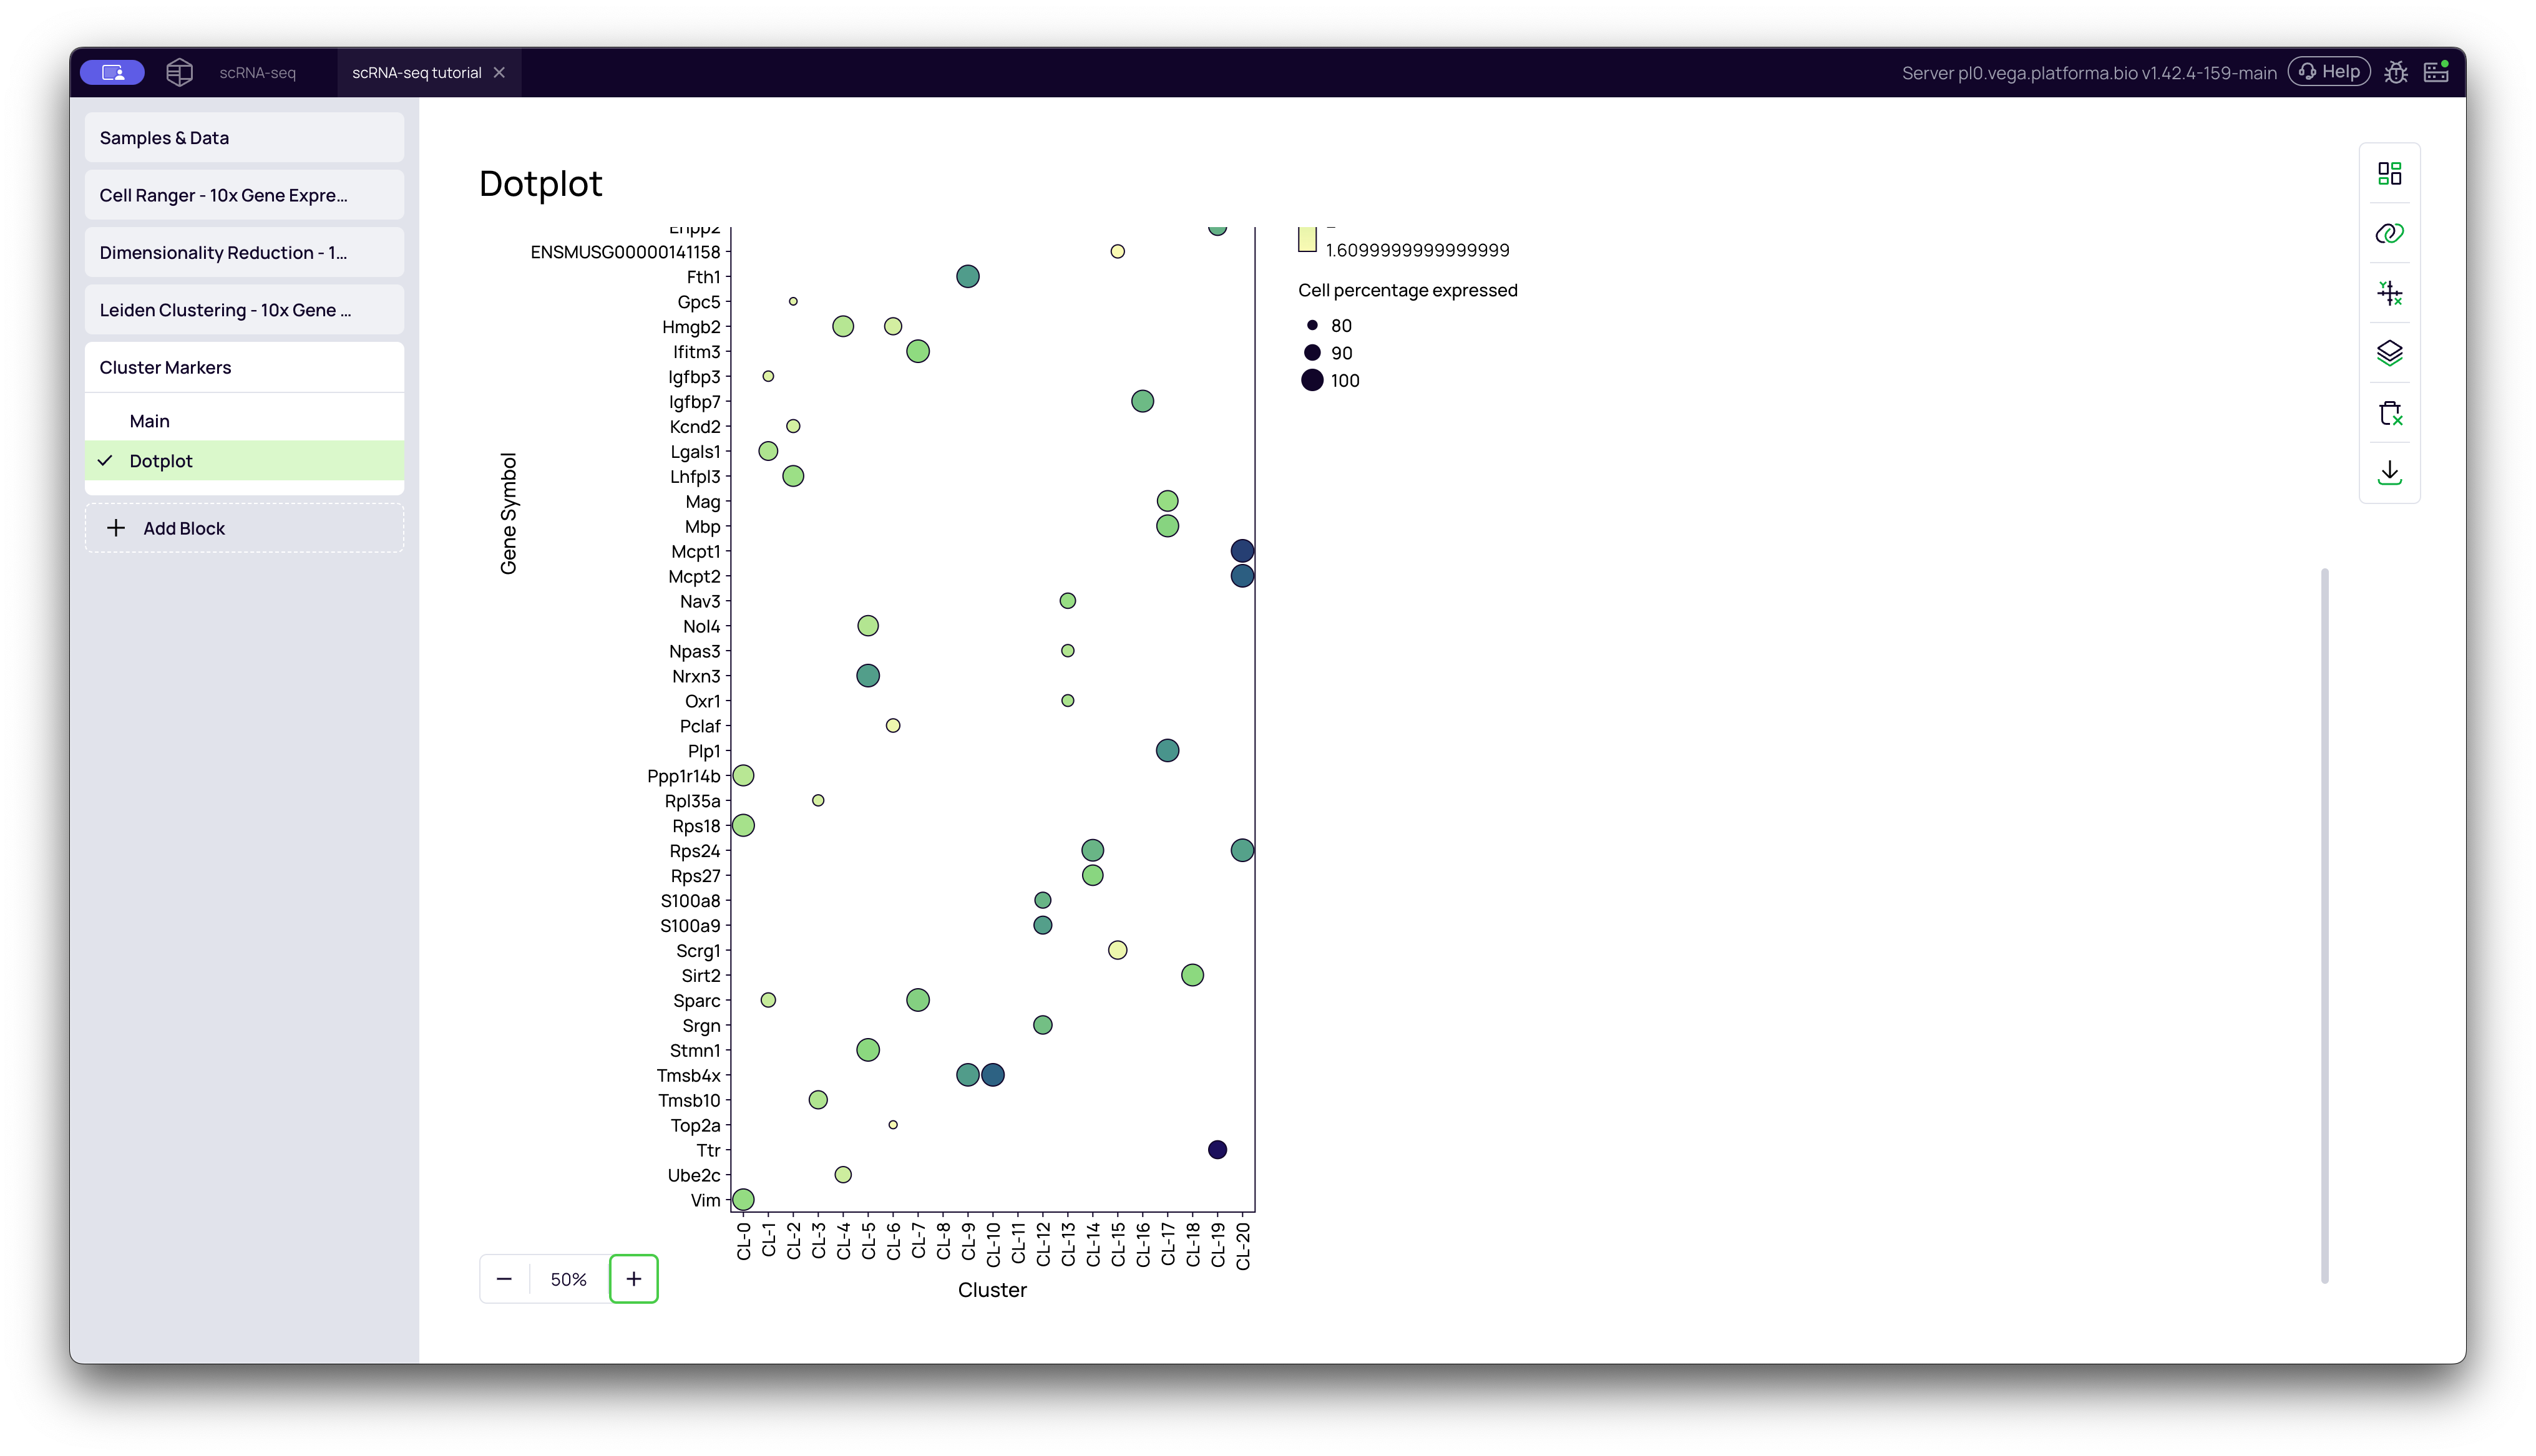
This tab provides a high-level summary of your marker genes. It is one of the most common visualizations in scRNA-seq.
How to read a dot plot:
- Y-axis: The list of top marker genes. (This list is controlled by your
Top markers per clustersetting). - X-axis: Your clusters (
CL-0,CL-1, etc.). - Dot SIZE: Represents the Cell percentage expressed. A larger dot means a higher percentage of cells in that cluster express the gene.
- Dot COLOR: Represents the Mean expression in cluster. A darker/hotter color (e.g., dark blue) means the cells that do express the gene are expressing a lot of it.
What to look for: The perfect marker gene will appear as a large, dark dot that is specific to a single cluster (column). This plot allows you to see, at a glance, which genes define which clusters.