Antibody Clustering
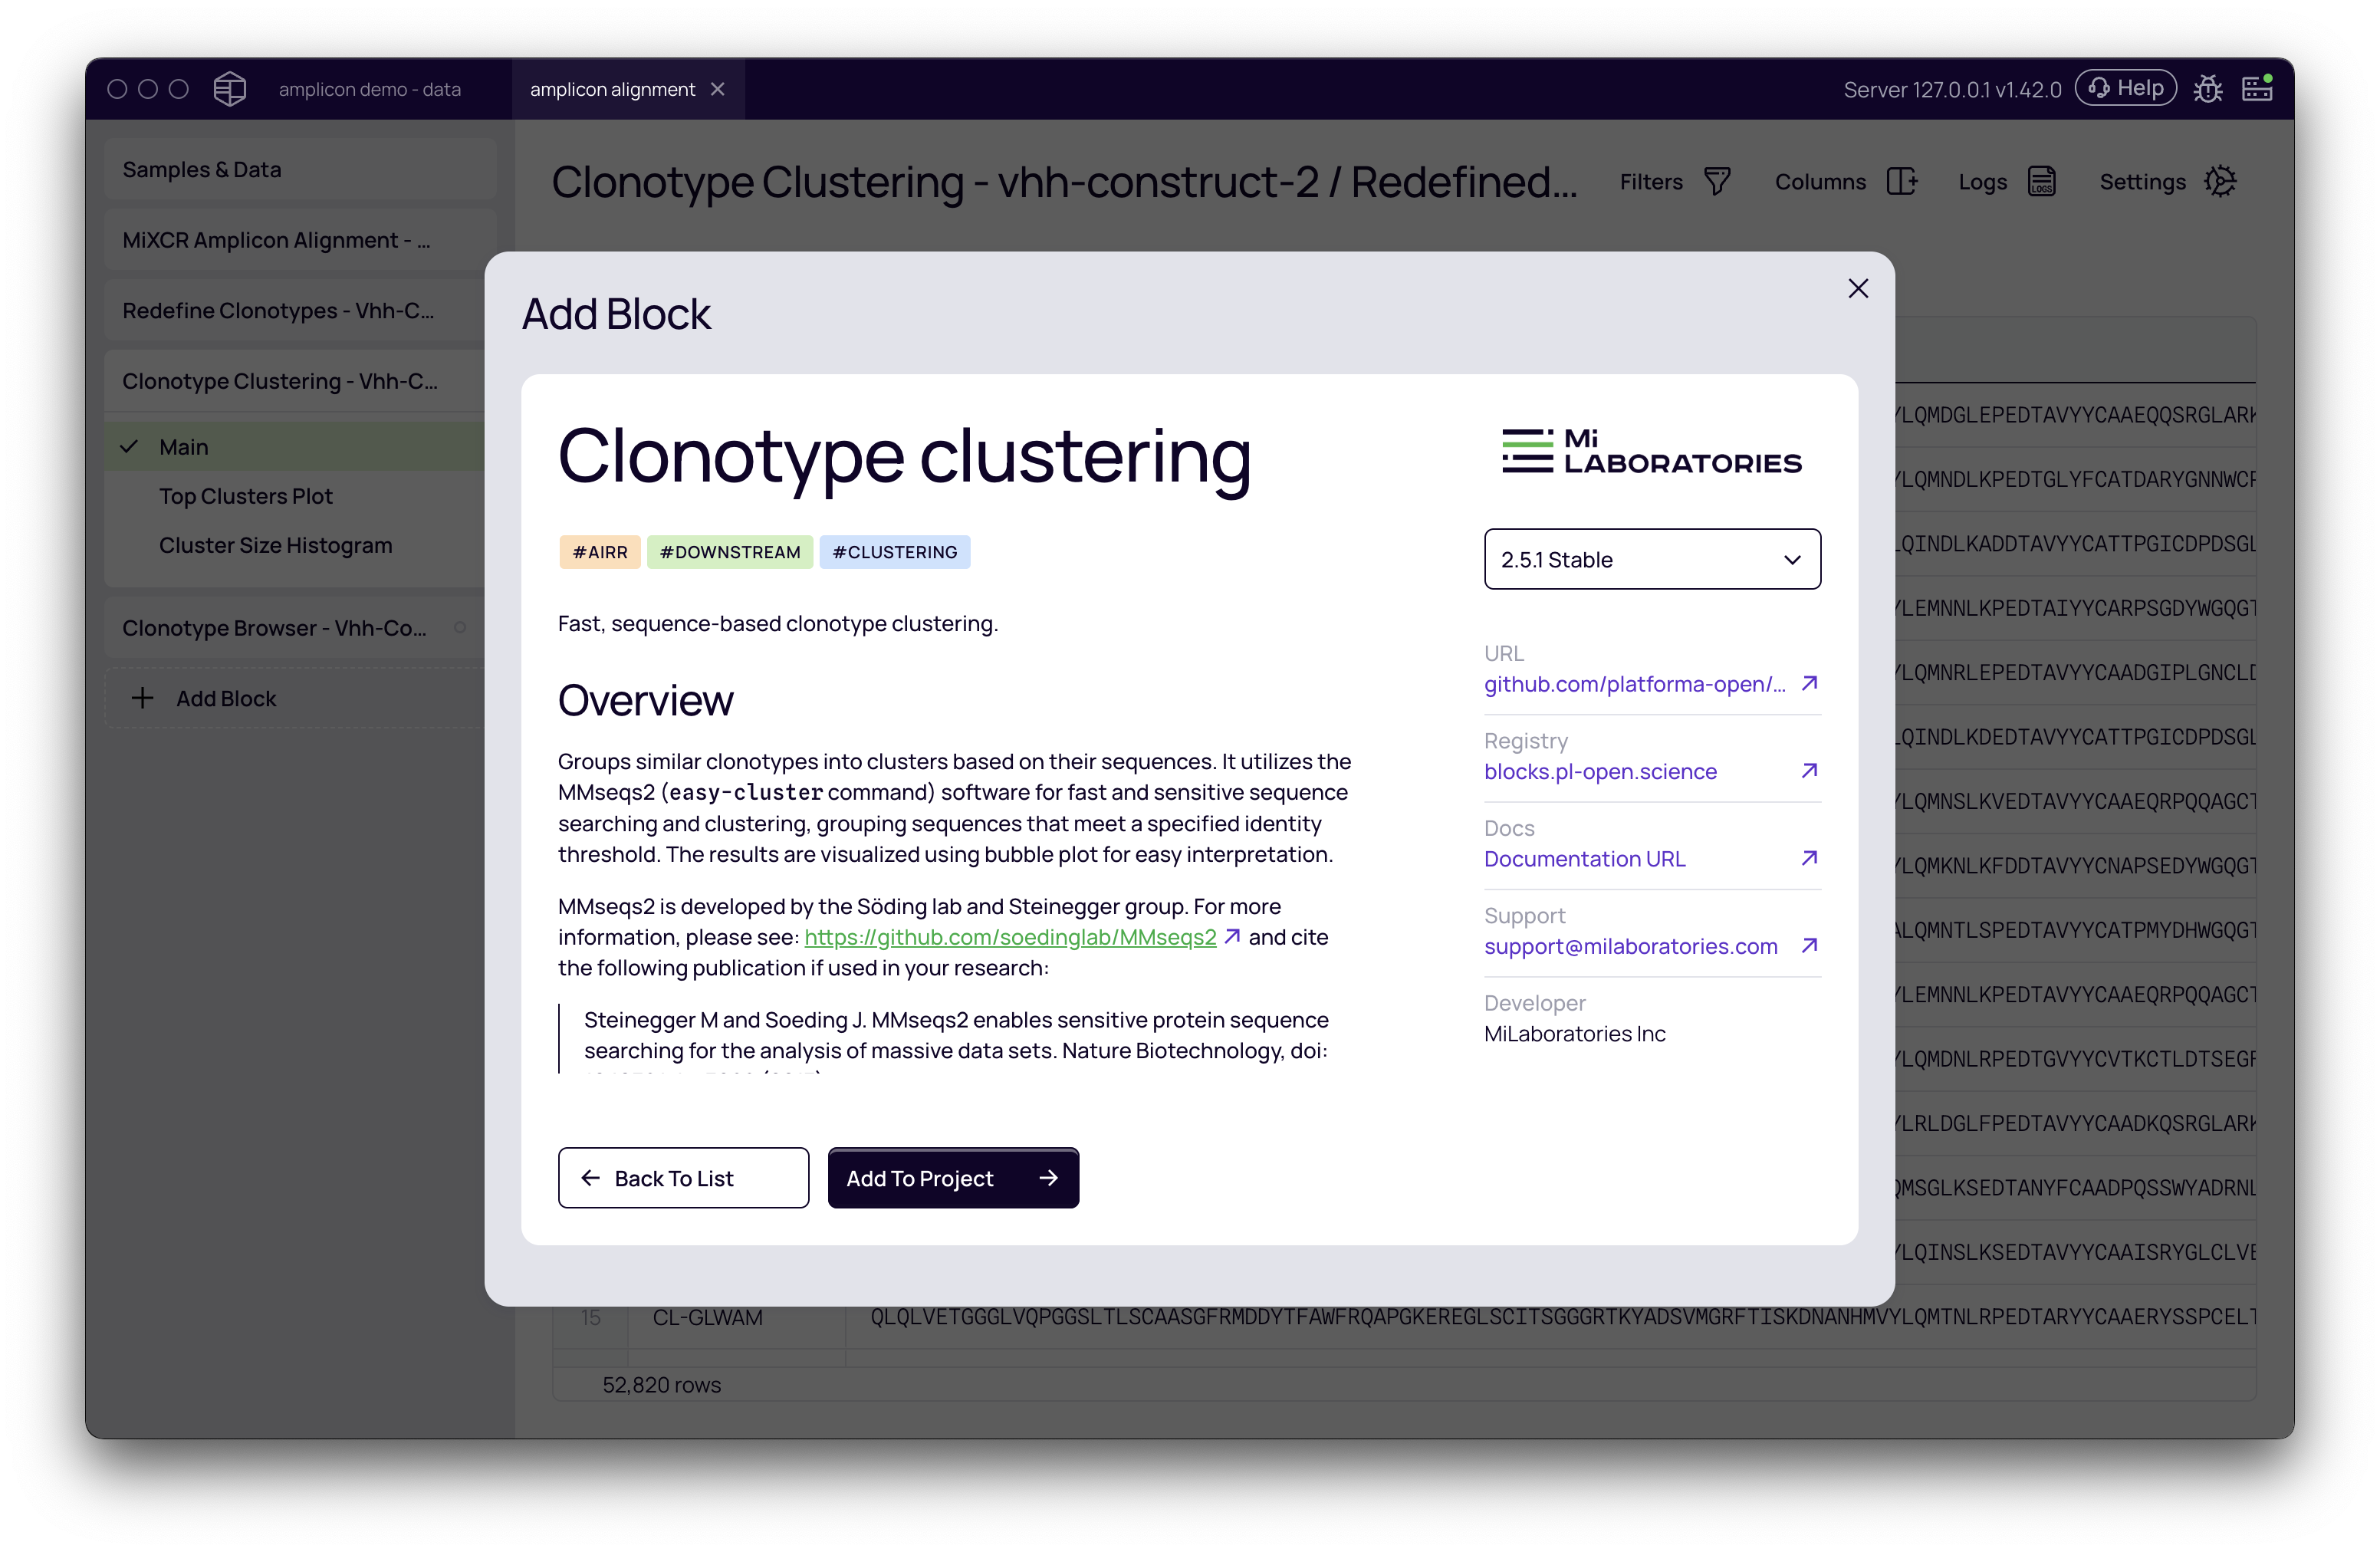
The Clonotype Clustering block groups similar antibody sequences into clusters based on user-defined criteria. This process is essential for identifying and analyzing families of related sequences that may share binding properties. Under the hood, this block leverages the powerful and fast MMseqs2 tool for sequence clustering.
This guide will walk you through configuring the clustering parameters, running the analysis, and interpreting the results.
Prerequisites
Before starting, ensure you have set up in your project and samples from each round of your selection experiment have been imported and processed with a clonotyping block.
How to Run Clonotype Clustering
Before running this block, you should have already processed your data through Amplicon Alignment and, typically, Redefine Clonotypes to work with unique protein sequences.
- From your project, click + Add Block and select Clonotype Clustering from the list. Add it to your project.
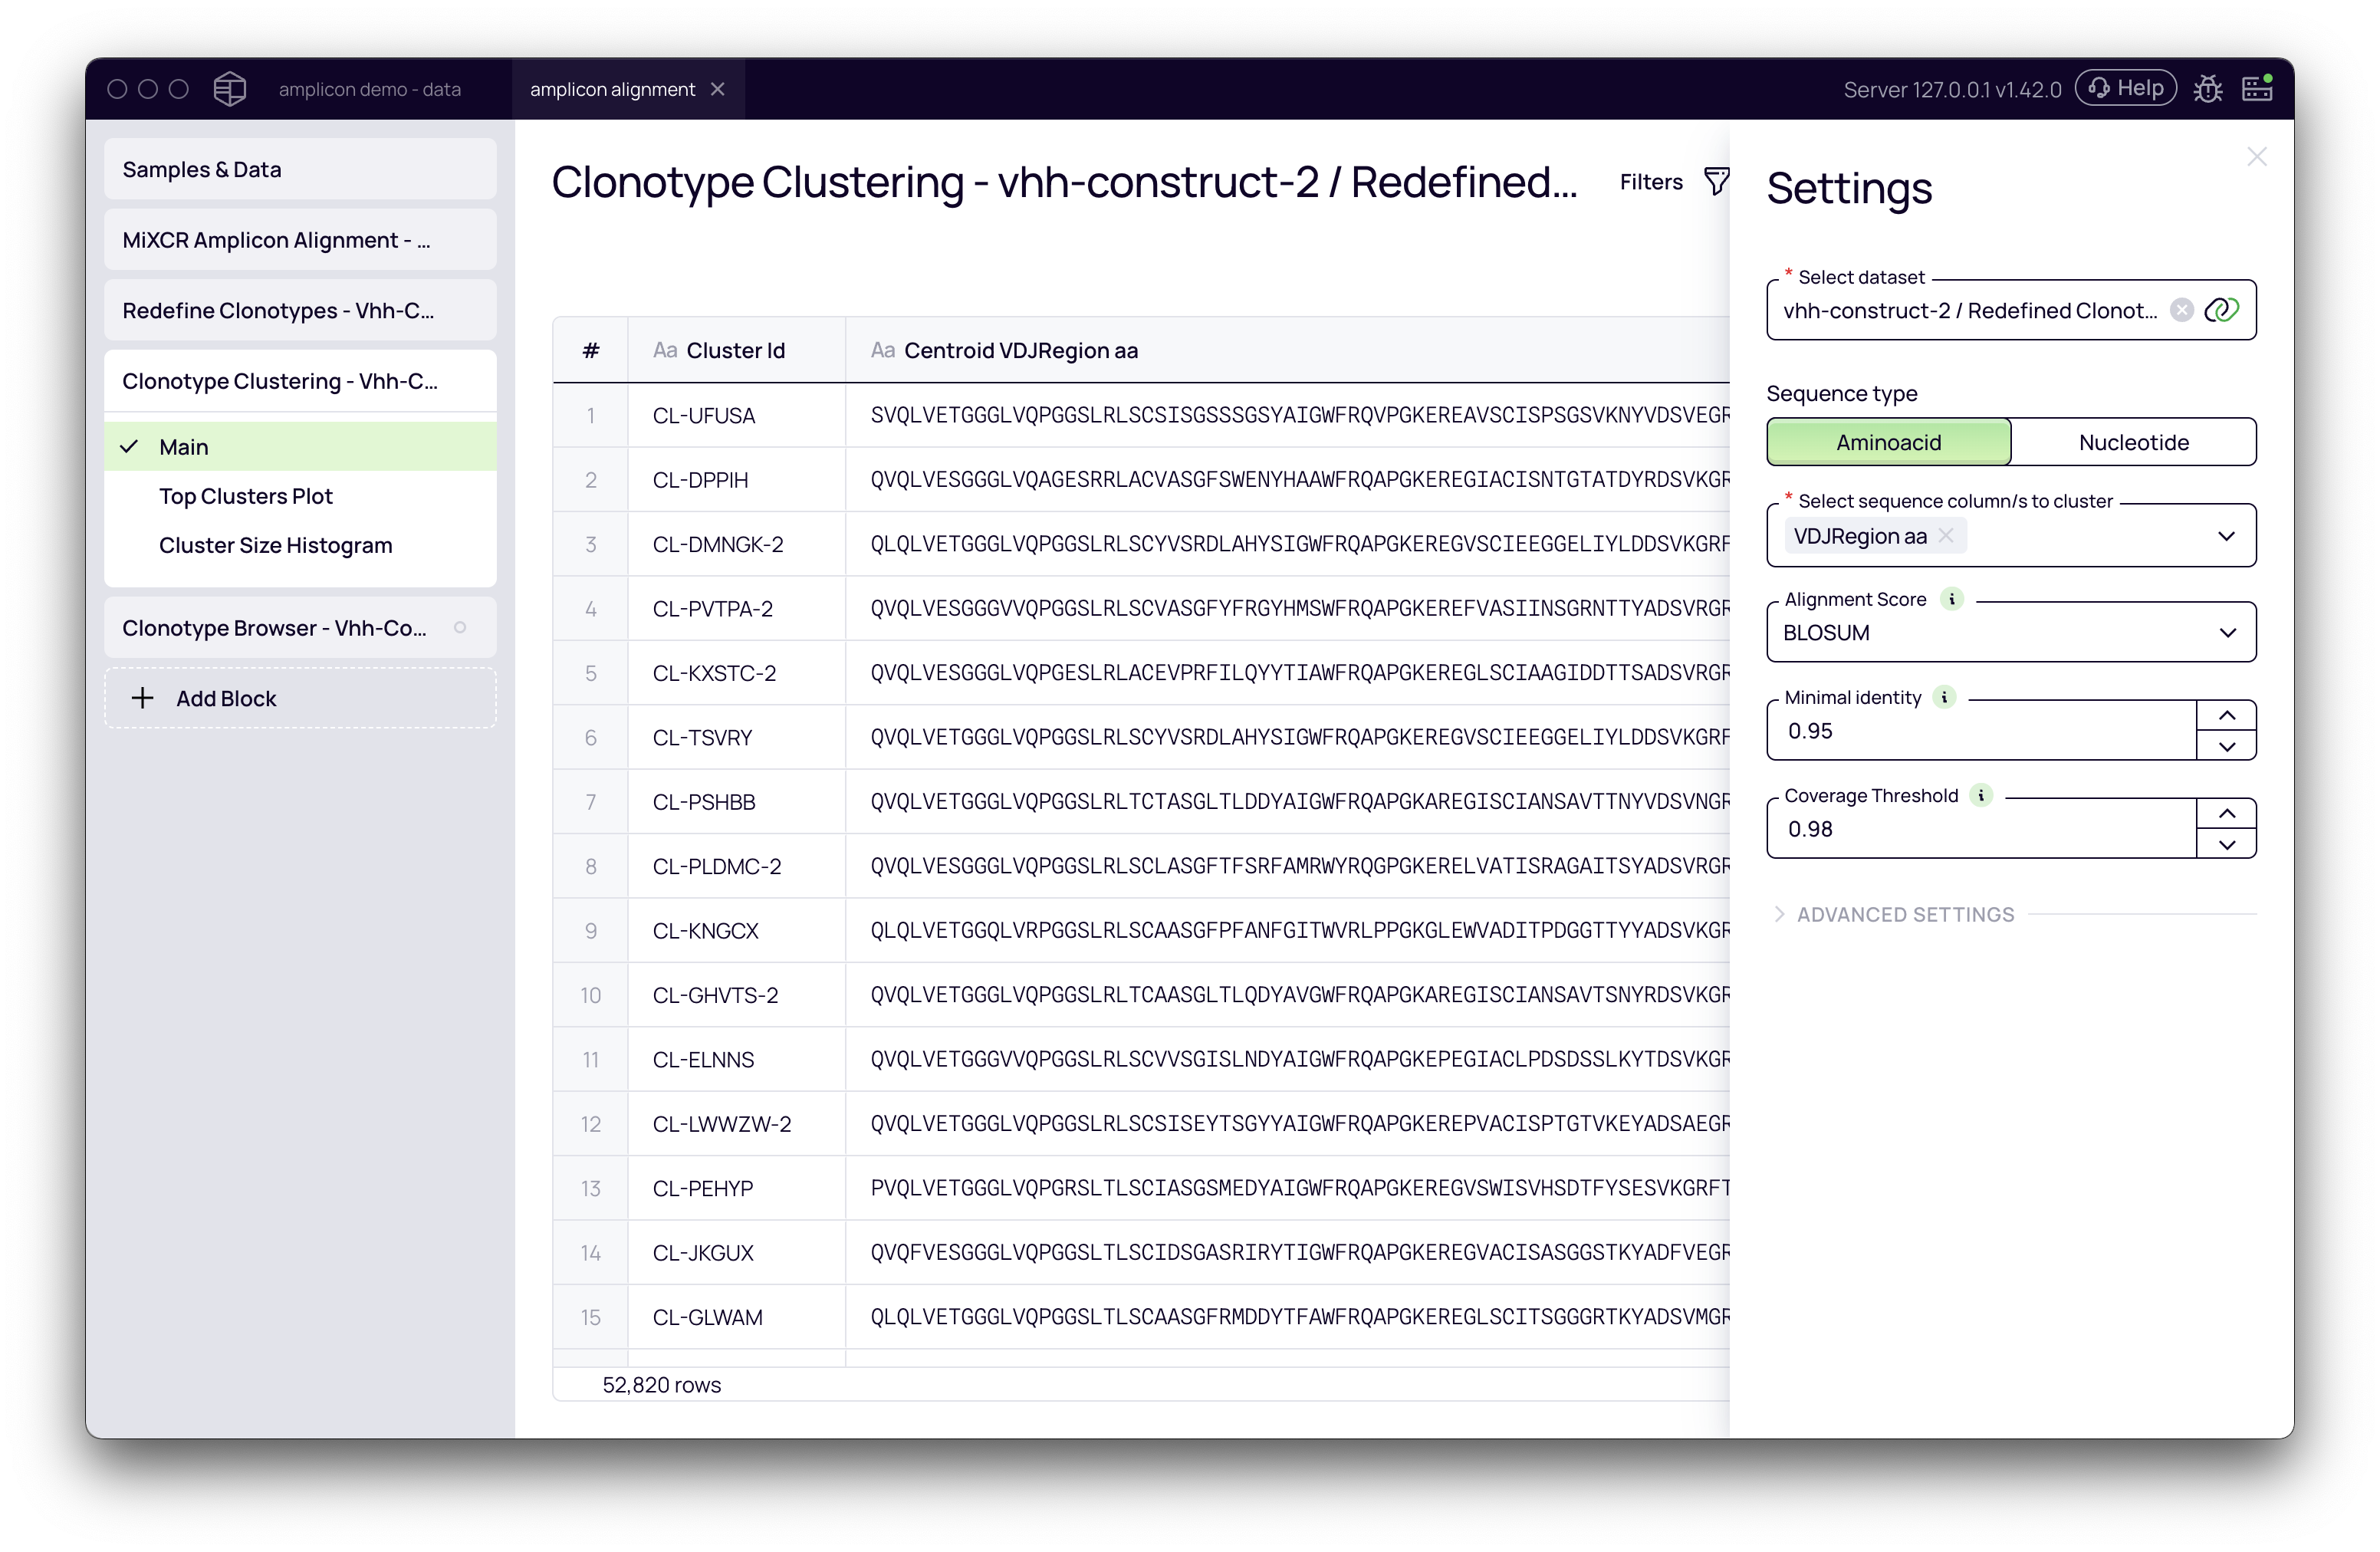
- In the Settings panel on the right, configure the clustering parameters.
- Click the Run button to start the analysis.
Understanding the Parameters
The accuracy and relevance of your clusters depend heavily on how you configure the following parameters.
Sequence Type
This setting determines whether the clustering algorithm will use amino acid or nucleotide sequences for comparison.
- Amino Acid: (Recommended for most antibody discovery workflows) Clusters are based on the protein sequences. This is generally preferred as it reflects the functional properties of the antibodies.
- Nucleotide: Clusters are based on the DNA sequences.
Select Sequence Column(s) to Cluster
This is a critical parameter that defines which part of the antibody will be used for similarity calculations. The optimal choice depends on your library type and analytical goals.
- VDJ Region: Uses the entire V-D-J region sequence. This is a good general-purpose option.
- CDRs (e.g., CDR3 aa, CDR1+CDR2+CDR3): Uses only the specified Complementarity-Determining Region(s). Clustering by CDRs, especially CDR3, is effective for grouping antibodies by their primary binding interface, which is particularly useful for synthetic libraries where diversity is concentrated in these regions.
- Frameworks (FRs): Uses the more conserved framework regions.
Alignment Score
This parameter defines the metric used to measure the similarity between two sequences.
- Exact Match: Calculates similarity based on the percentage of identical residues.
- BLOSUM: Uses the BLOSUM substitution matrix, which scores similarity based on the biochemical properties of amino acids. Two different but biochemically similar residues (e.g., Leucine and Isoleucine) will receive a better score than two dissimilar ones. This is often a more biologically relevant metric.
Minimal Identity
This sets the minimum similarity score (from 0.0 to 1.0) required for two sequences to be grouped into the same cluster.
💡 Tip: The ideal value depends on the region you are clustering.
- When clustering on a short, diverse region like CDR3, a lower threshold like the default
0.8(80%) is often appropriate.- When clustering on the entire VDJ region, which is much longer and contains conserved frameworks, a higher threshold such as
0.95(95%) is recommended to avoid grouping unrelated sequences.
Coverage Threshold
This sets the minimum percentage of a sequence's length that must be aligned for it to be considered for clustering. This prevents short, partial sequences from being clustered with longer ones based on a small patch of similarity. It is generally recommended to set this value to be equal to or greater than the Minimal Identity.
Advanced Settings
- Resource Allocation: You can specify the maximum Memory (GB) and CPU (cores) to allocate to the job.
Interpreting the Results
After the analysis is complete, the block generates several views to help you explore the clusters.
Main Clusters Table
This is the primary output view, providing a summary table of all clusters found.
- Cluster ID: A unique identifier for each cluster.
- Centroid VDJ Region aa: The amino acid sequence of the most representative member (the centroid) of the cluster.
- Cluster Radius: A measure of the diversity within the cluster. It represents the distance from the centroid sequence to the most dissimilar member.
- Cluster Size: The total number of unique clonotypes in the cluster.
You can sort the table by any column, for example, to quickly find the largest or most diverse clusters.
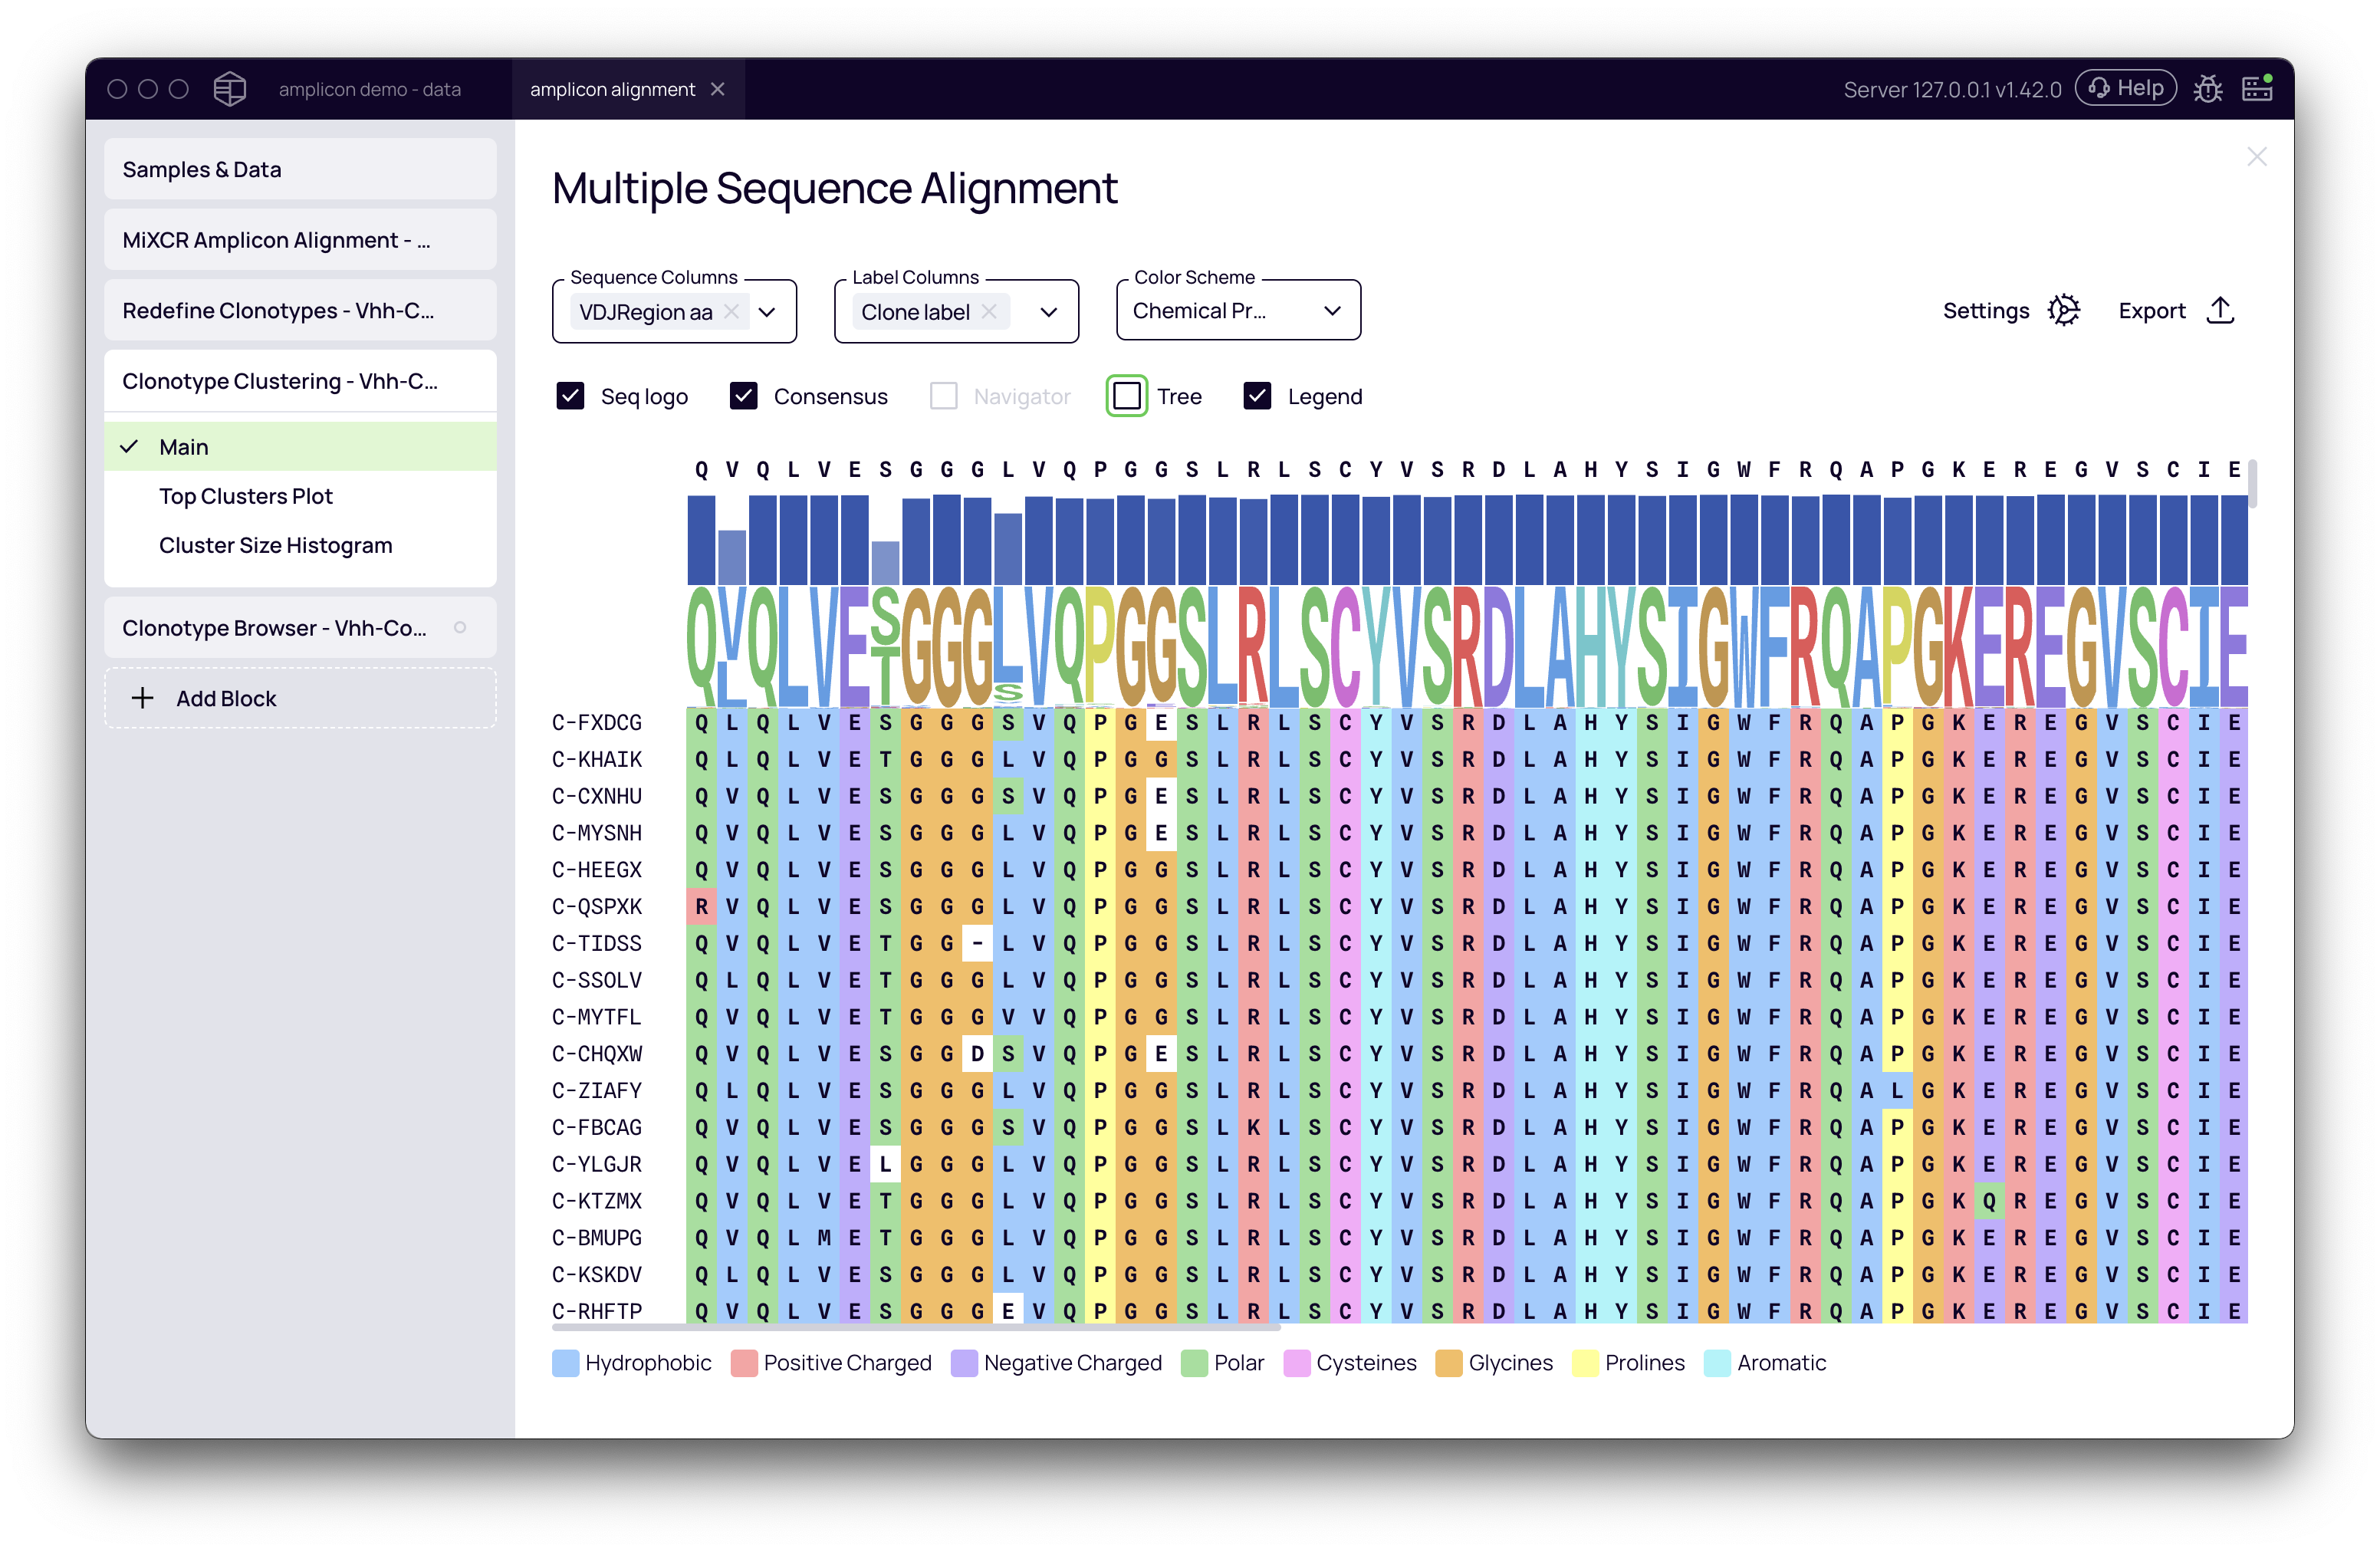
Exploring Individual Clusters (Multiple Sequence Alignment)
Clicking on any row in the main table opens a Multiple Sequence Alignment (MSA) view for that specific cluster. This powerful tool allows you to:
- Visualize the sequence conservation and variation within the cluster.
- Color the alignment by Chemical Properties to identify patterns in amino acid usage.
- Highlight CDRs and Frameworks to see where the diversity is concentrated.
- View a phylogenetic tree to understand the relationships between sequences.
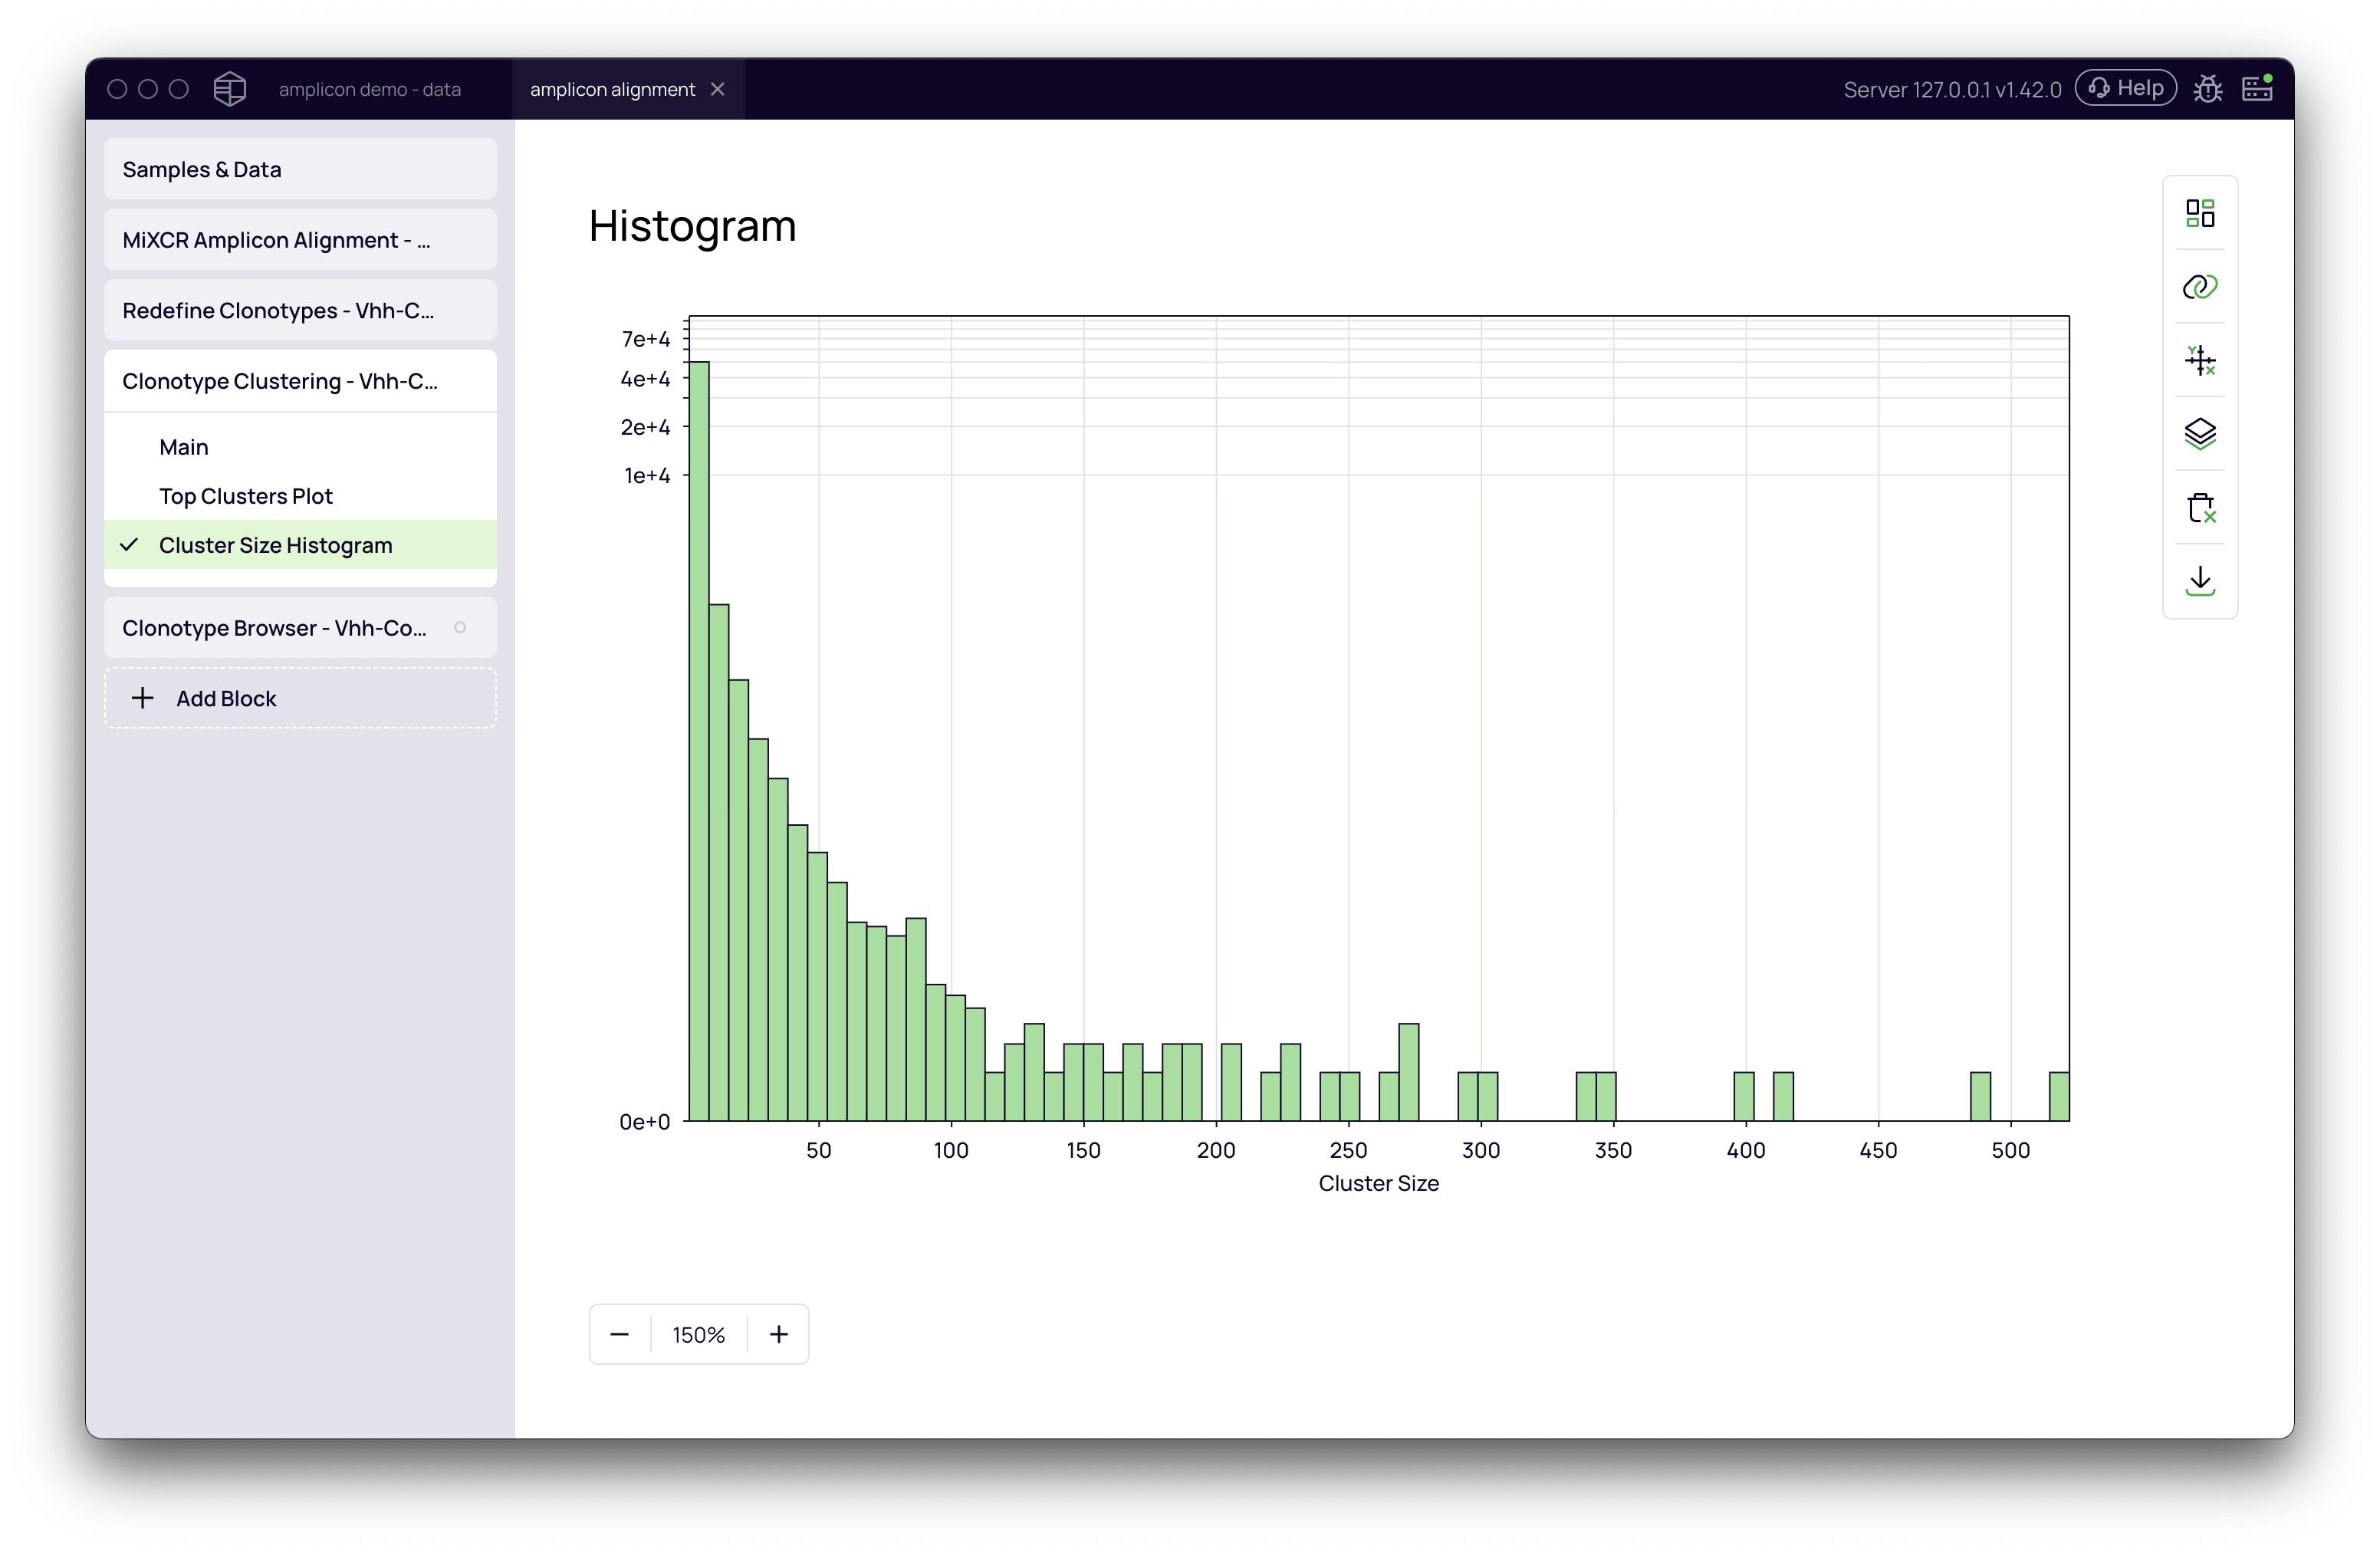
Cluster Size Histogram
This plot provides a high-level overview of your clustering results, showing the distribution of cluster sizes. Typically, you will see a large number of small clusters (including singletons, or clusters of size 1) and a smaller number of large clusters.
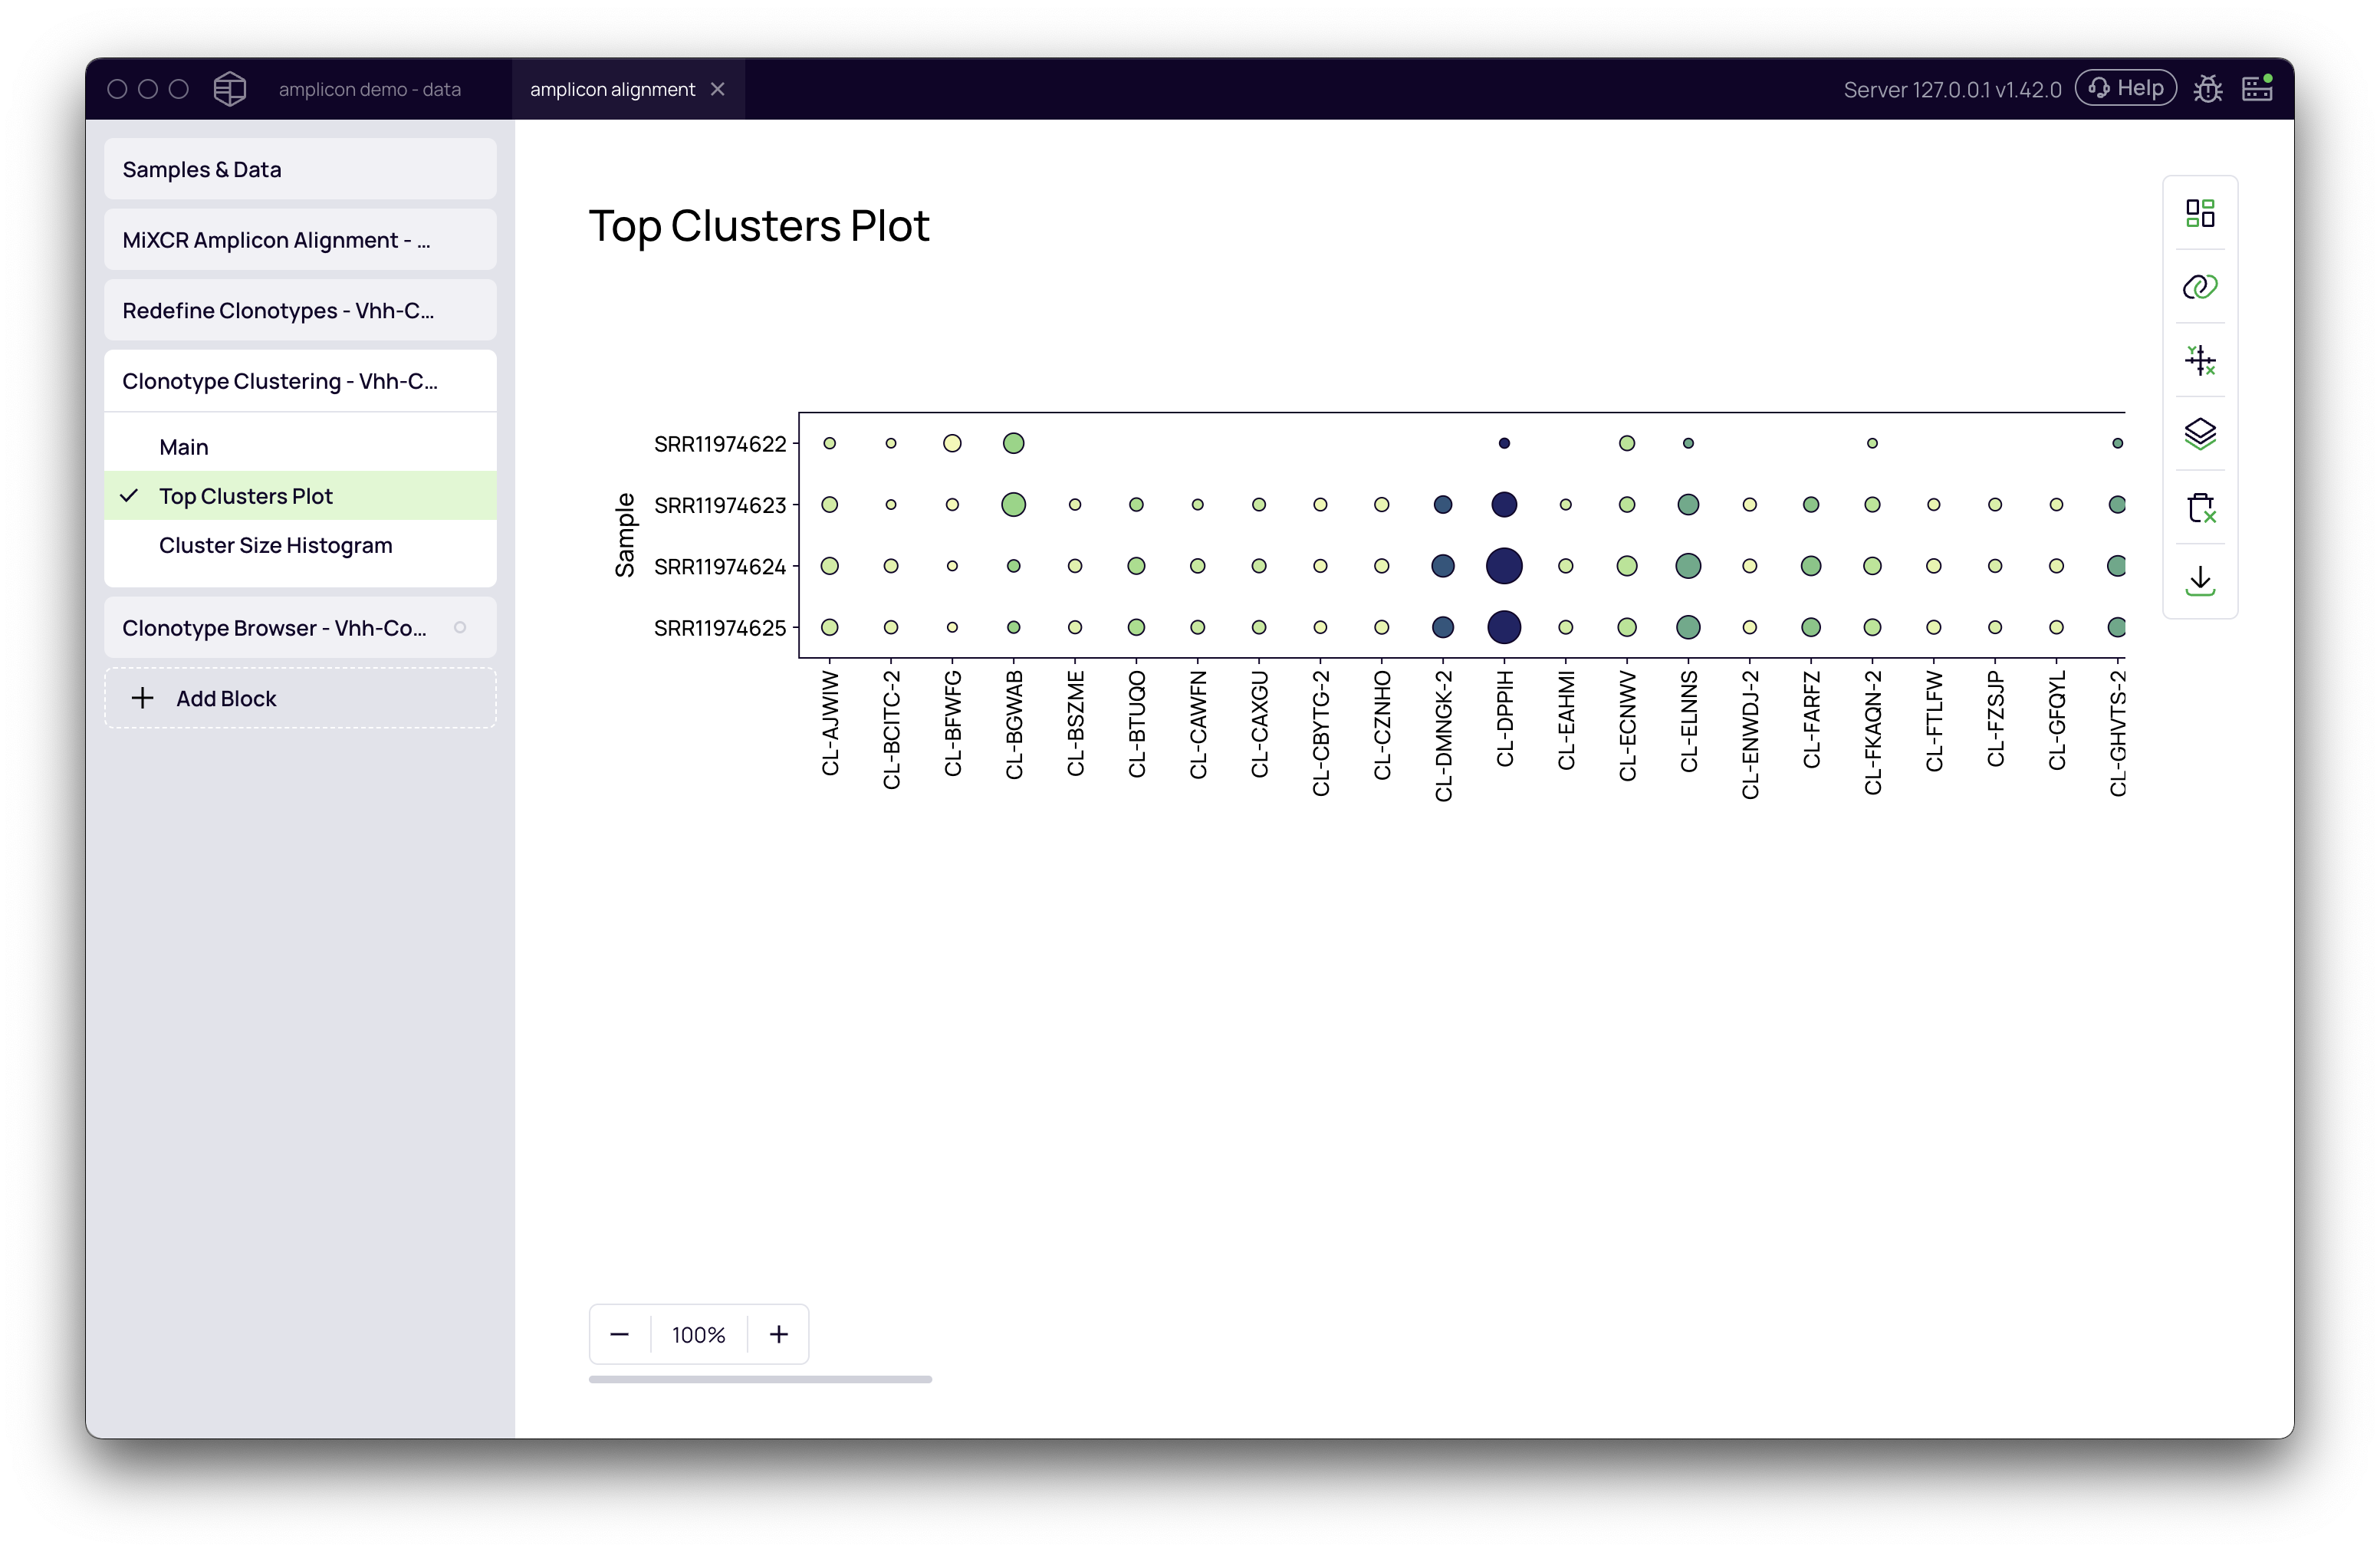
Top Clusters Plot
This bubble plot visualizes the most abundant clusters across all your samples, allowing you to quickly identify dominant sequence families.
Downstream Analysis
The cluster assignments are automatically integrated into your dataset and can be used in downstream analysis blocks. For example:
- In the Clonotype Browser, the Cluster ID is available as a column, allowing you to filter and inspect the members of any cluster.
- In the Clonotype Enrichment block, you can select the abundance of Clusters instead of individual clonotypes to track how entire families of related sequences are enriched across different selection rounds or conditions.