Antibody Lead Selection
The Antibody/TCR Lead Selection block is a powerful downstream tool designed to automate and streamline the process of identifying the most promising antibody candidates from your datasets. It serves as a capstone analysis, integrating results from upstream enrichment, clustering, liability assessments, and somatic hypermutation (SHM) analysis to help you filter, rank, and select a final list of diverse, high-quality leads for subsequent wet-lab validation.
The block intelligently adapts to your discovery workflow, offering specialized presets for in vivo and in vitro campaigns. For in vivo discovery, it provides a composite "In Vivo Score" that combines clonal frequency with mutation quality metrics. For in vitro display campaigns, it focuses on enrichment scores across panning rounds. The core diversified ranking algorithm ensures your final selection represents the broadest possible sequence diversity while respecting your ranking priorities.
Prerequisites
Before using this block, you should have a project that contains a clonotype table from an upstream analysis. This can be generated by:
- Processing raw sequencing data with a clonotyping block (e.g., MiXCR Clonotyping).
- Importing a pre-computed clonotype table with the Import V(D)J Data block.
Additionally, for the block to automatically apply its powerful default settings and workflow-specific features, your project should include the following completed analysis steps:
For In Vivo Discovery Workflows:
- Clonotype Clustering or Paratope Clustering: To group similar antibody sequences into clusters for diversified selection. Paratope clustering identifies functionally similar antibodies by their predicted binding sites.
- Antibody Sequence Liabilities: To predict and flag potential development liabilities.
- Clonotype Space: To generate a UMAP visualization of the entire antibody repertoire.
The block automatically detects when somatic hypermutation (SHM) metrics are present from MiXCR and enables the In Vivo Score composite ranking.
For In Vitro Display Workflows:
- Clonotype Clustering: To group similar sequences.
- Clonotype Enrichment: To calculate which clonotypes or clusters are enriched across rounds of selection (panning).
- Antibody Sequence Liabilities: (Optional) To filter out developability liabilities.
Adding the lead selection block
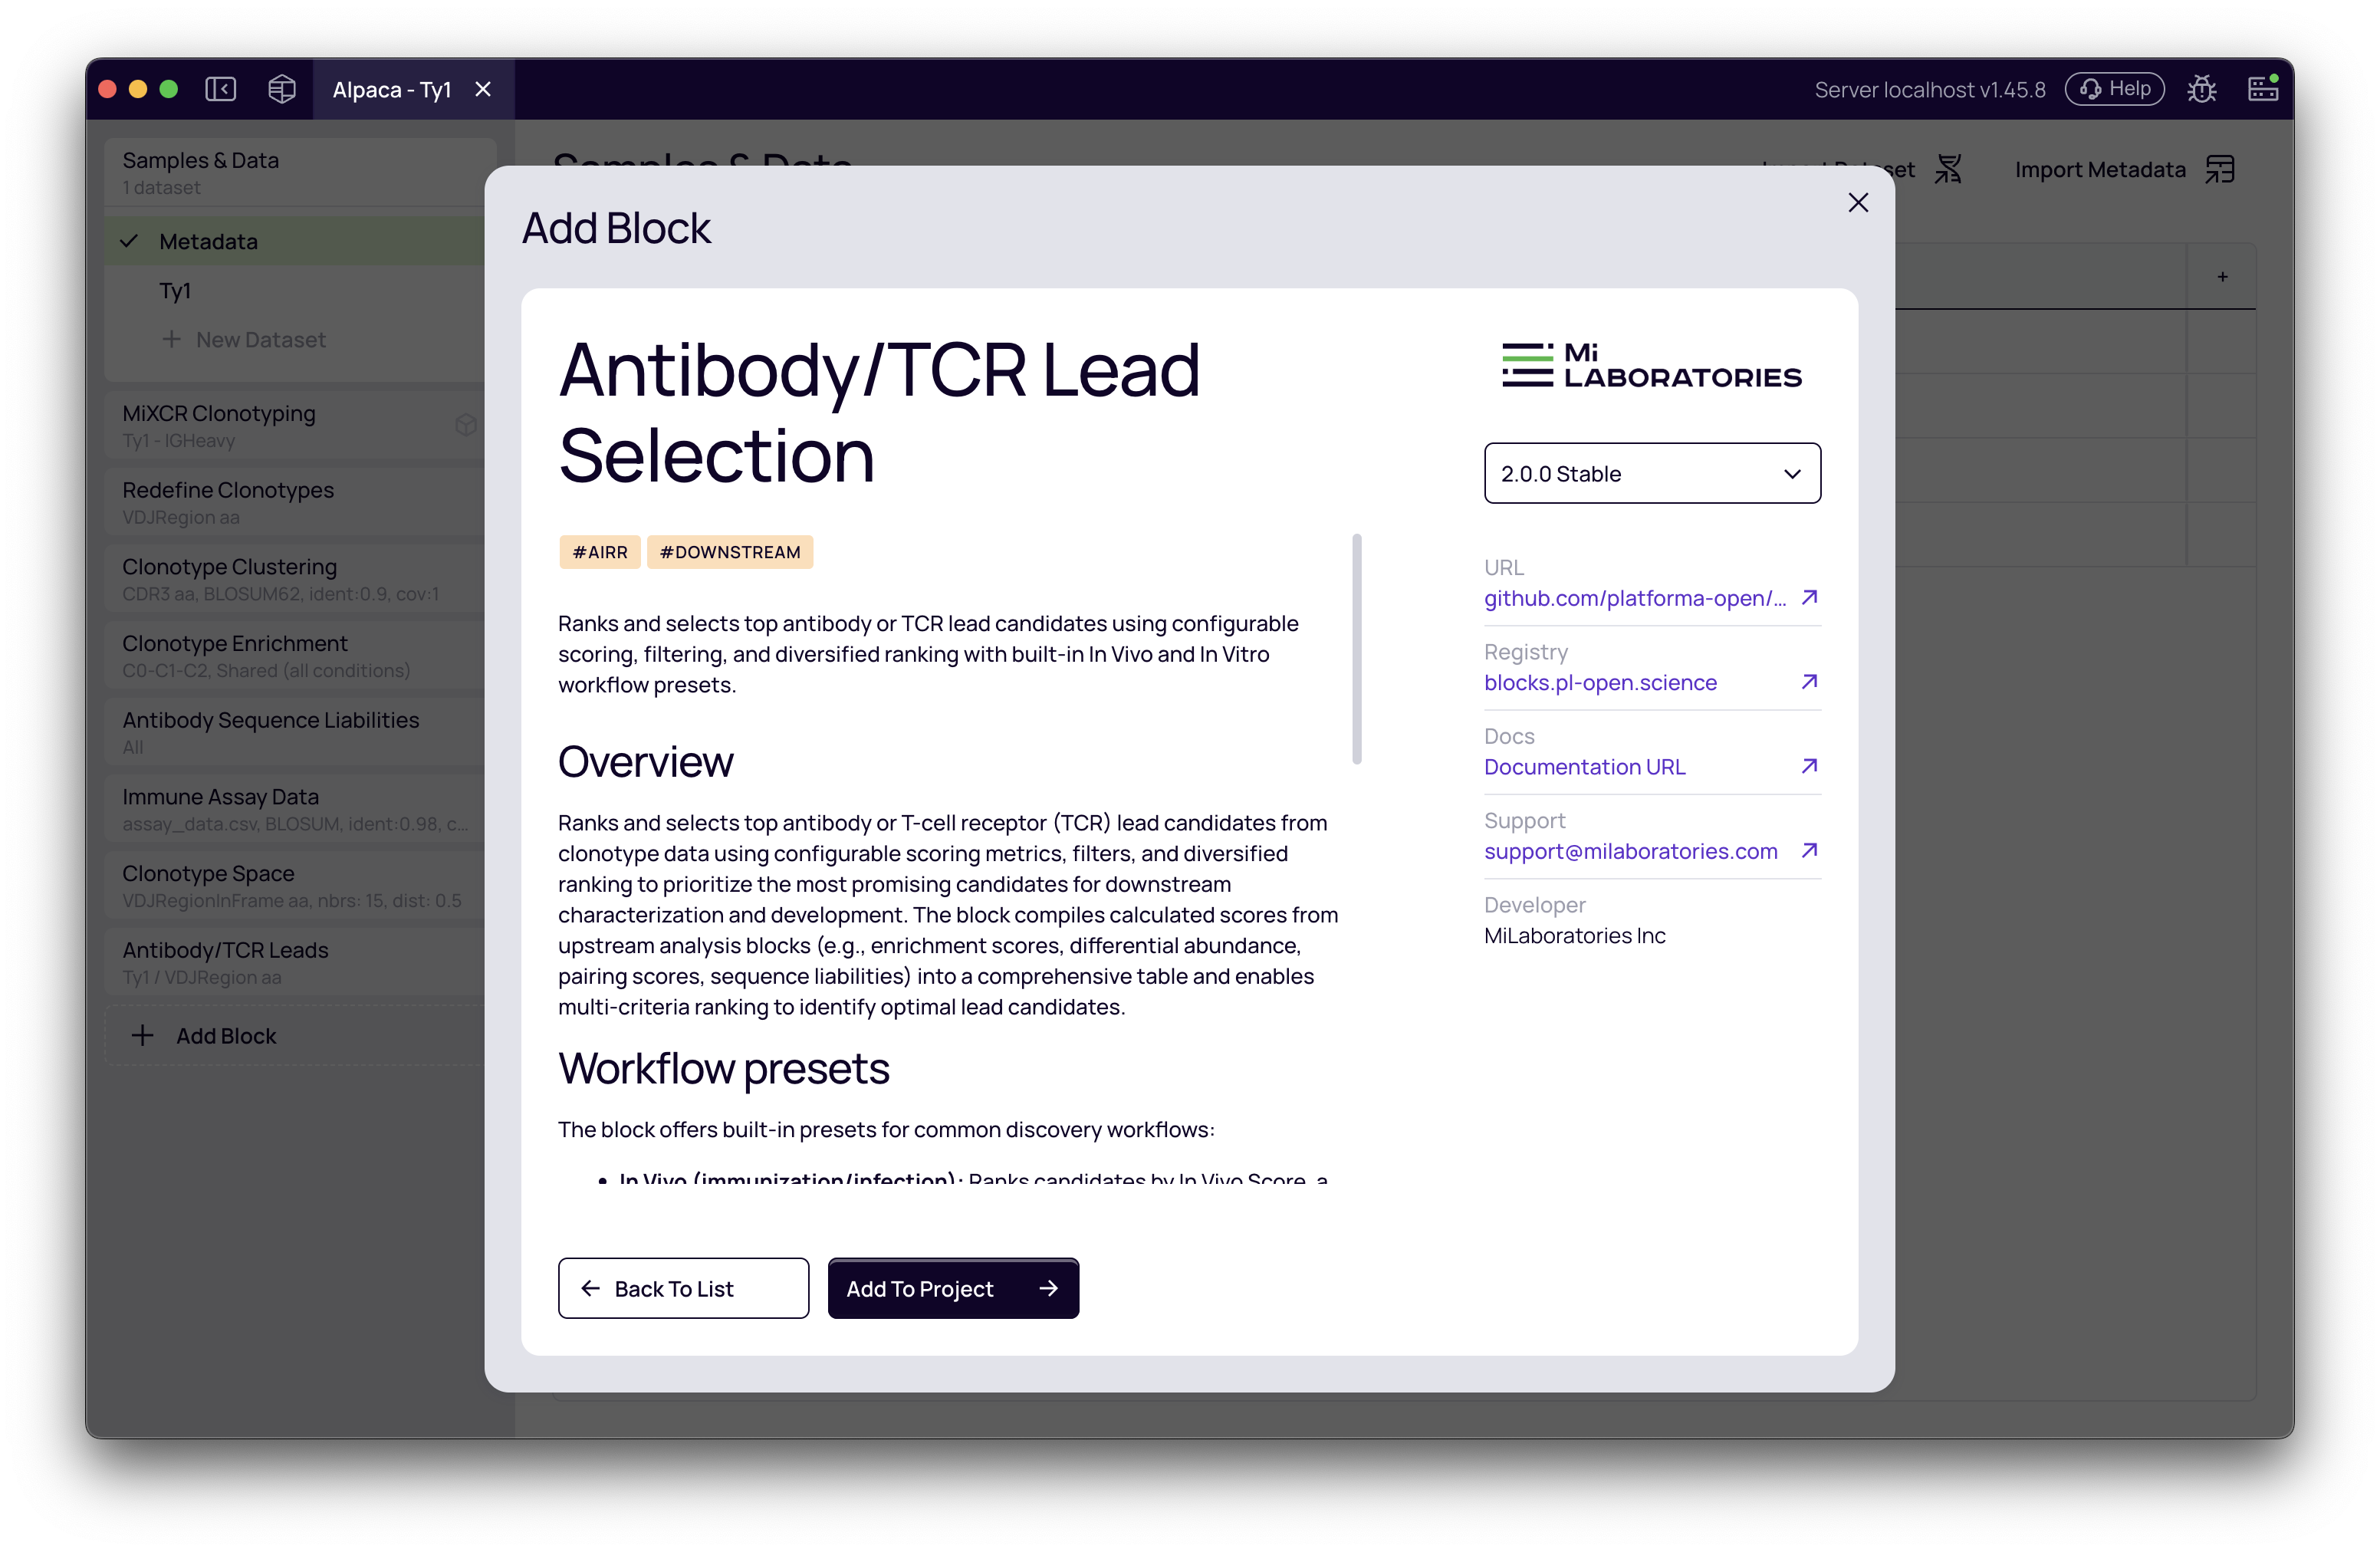
First, add the Antibody/TCR Lead Selection block to your project.
- In your project, click Add Block.
- Use the search bar to find and select the Antibody/TCR Lead Selection block.
- Click the block to add it to your analysis workflow.
Choosing your workflow preset
Once the block is added, the first step is to select your input dataset. After selecting a dataset, you can choose a workflow preset that configures filters and ranking criteria appropriate for your experimental approach.
Select workflow preset
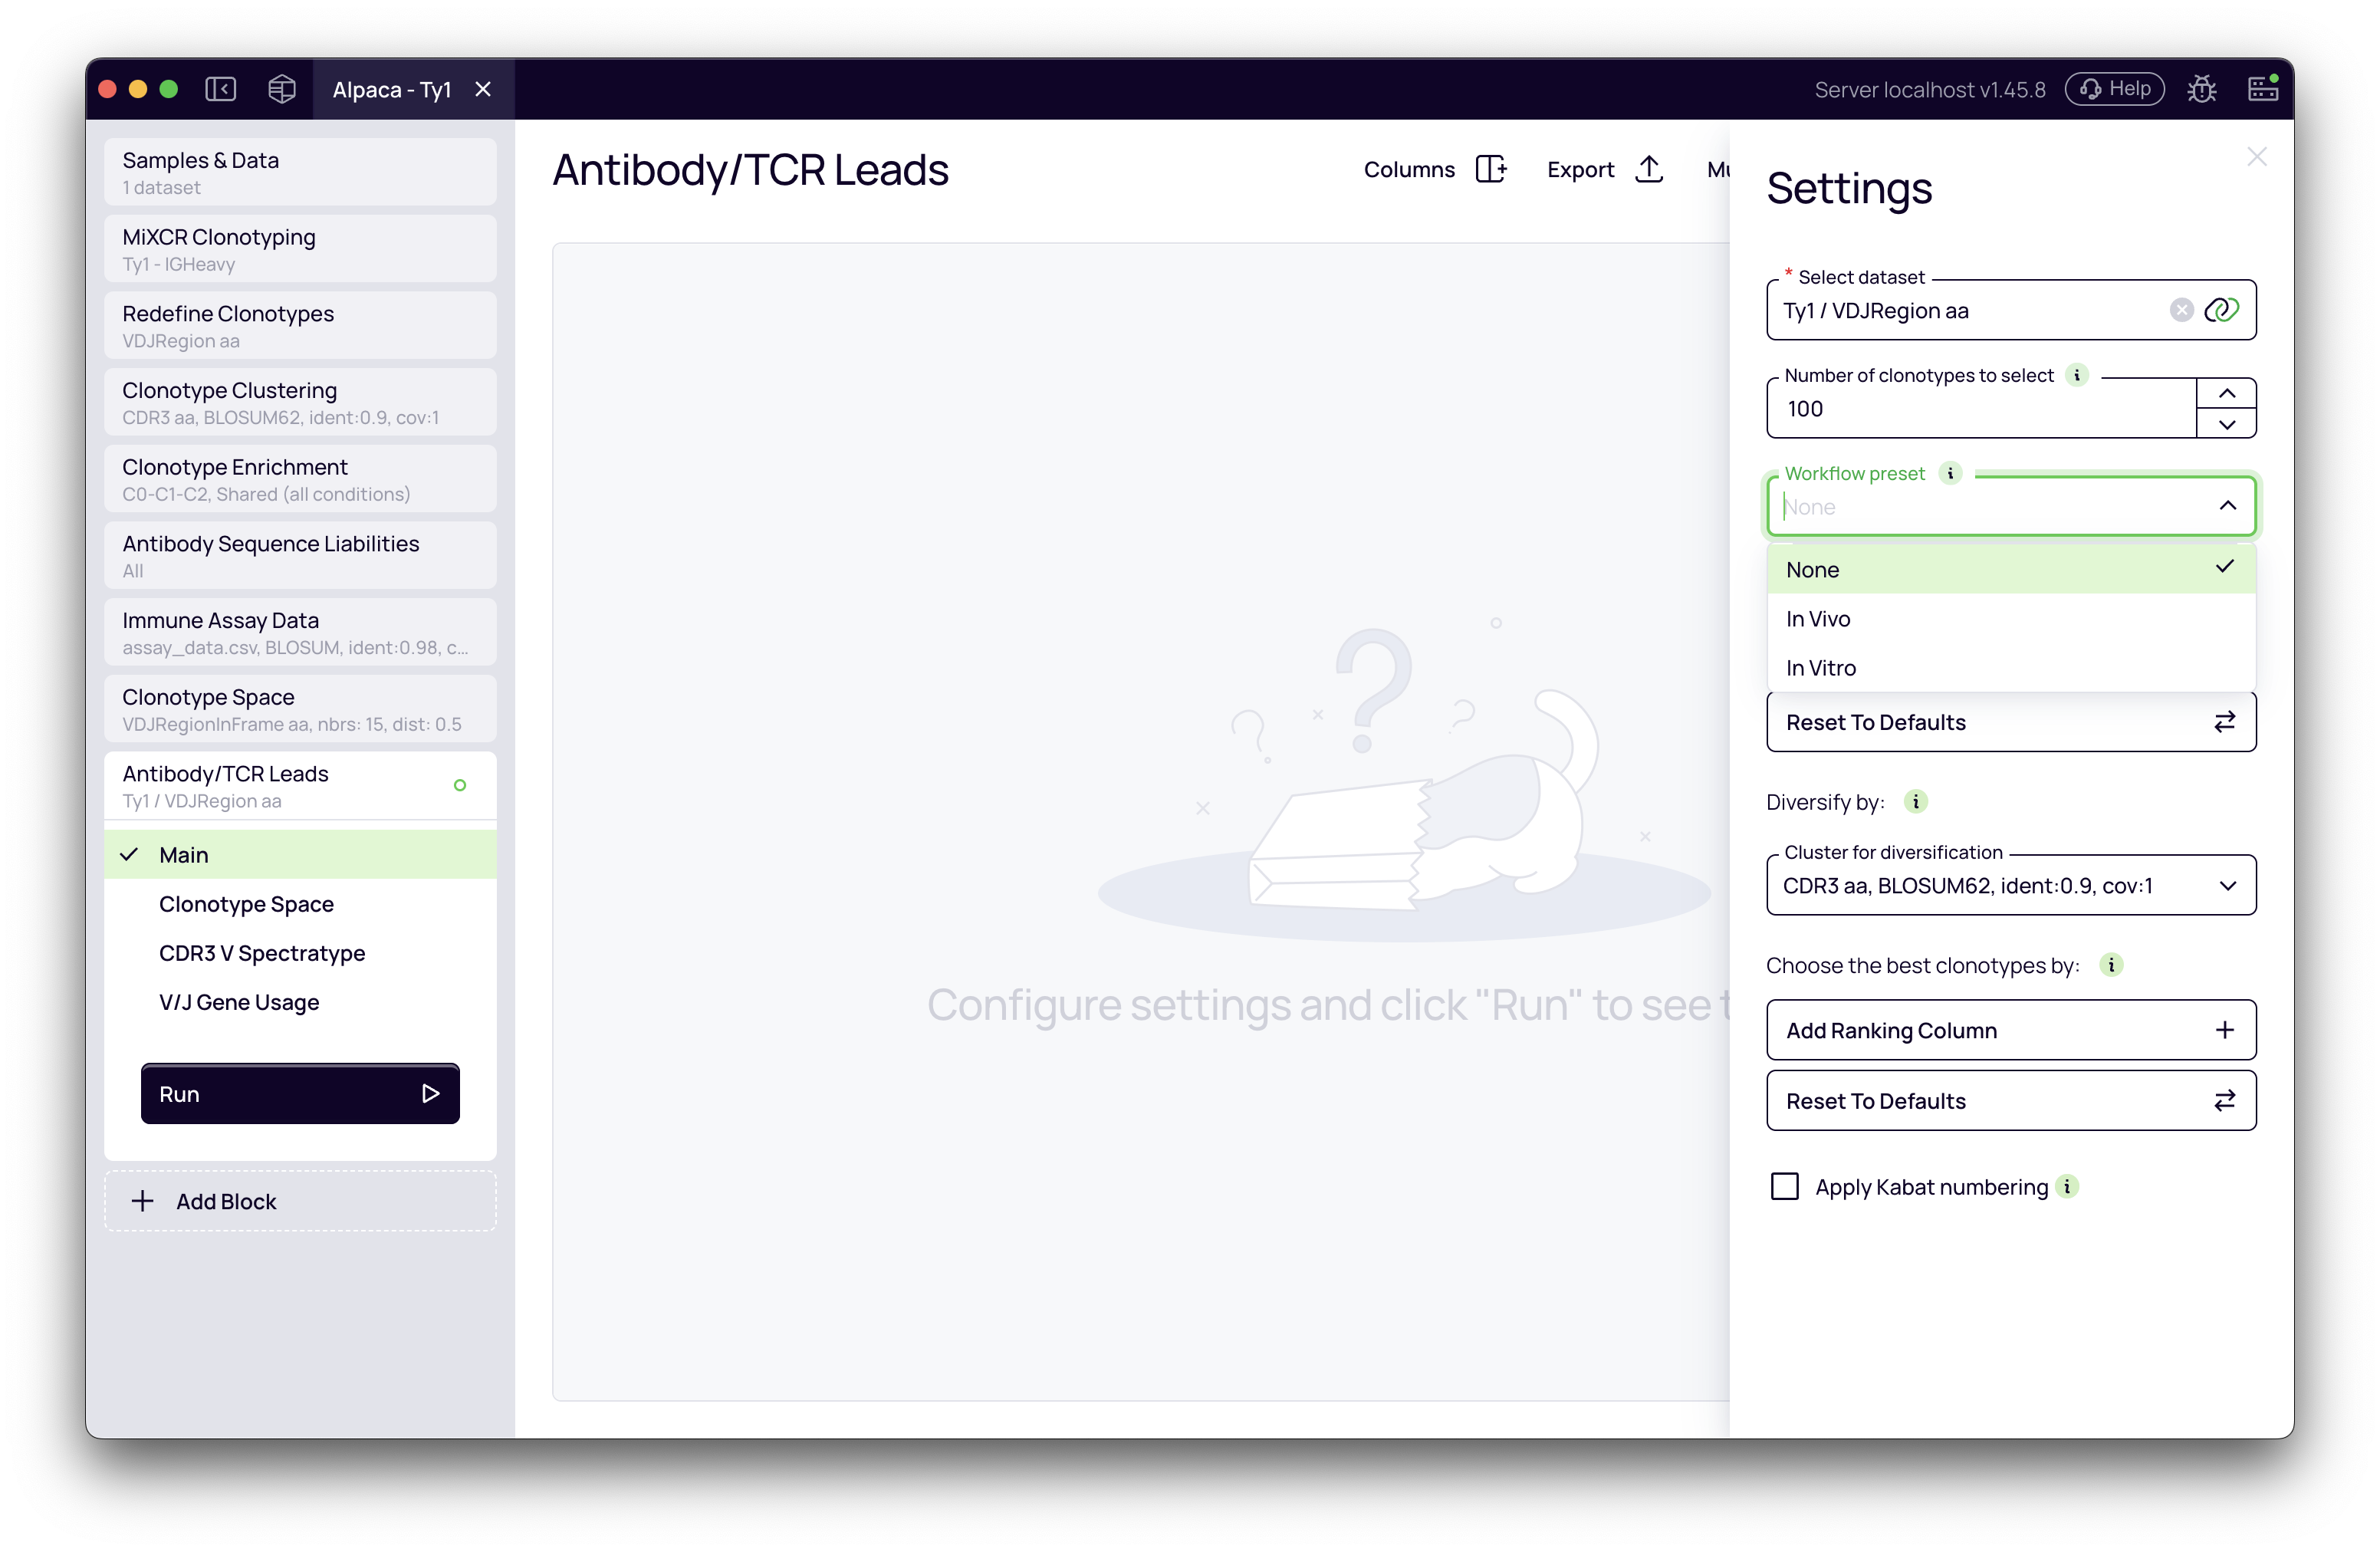
In the Settings panel, you'll see a Workflow Preset dropdown with three options:
- None: Uses annotation-driven defaults from upstream blocks without workflow-specific adjustments.
- In Vivo: Optimized for immunized animal or natural infection studies. Prioritizes clonal expansion with high-quality somatic hypermutation patterns (CDR-focused mutations, low framework mutations).
- In Vitro: Optimized for display technologies (phage, yeast, ribosome display). Prioritizes enrichment scores across panning rounds.
Understanding preset-specific defaults
Each preset applies different automatic filters and ranking criteria:
In Vivo Preset:
- Default Ranking: "In Vivo Score" (composite of clonal frequency + mutation quality)
- Default Filters:
- Liabilities risk:
NoneorLowonly - CDR mutation fraction > 0.5 (excludes clones with framework-heavy mutations)
- Nt mutations ≥ 3 (excludes near-germline clones)
- Liabilities risk:
In Vitro Preset:
- Default Ranking: Max Enrichment
- Default Filters:
- Liabilities risk:
NoneorLowonly - Max Enrichment > 1.0 (log₂ fold change cutoff)
- Binding Specificity (when antigen specificity analysis is enabled): filters for target-specific binders
- Enrichment Quality (when available): filters for high-quality enrichment patterns
- Liabilities risk:
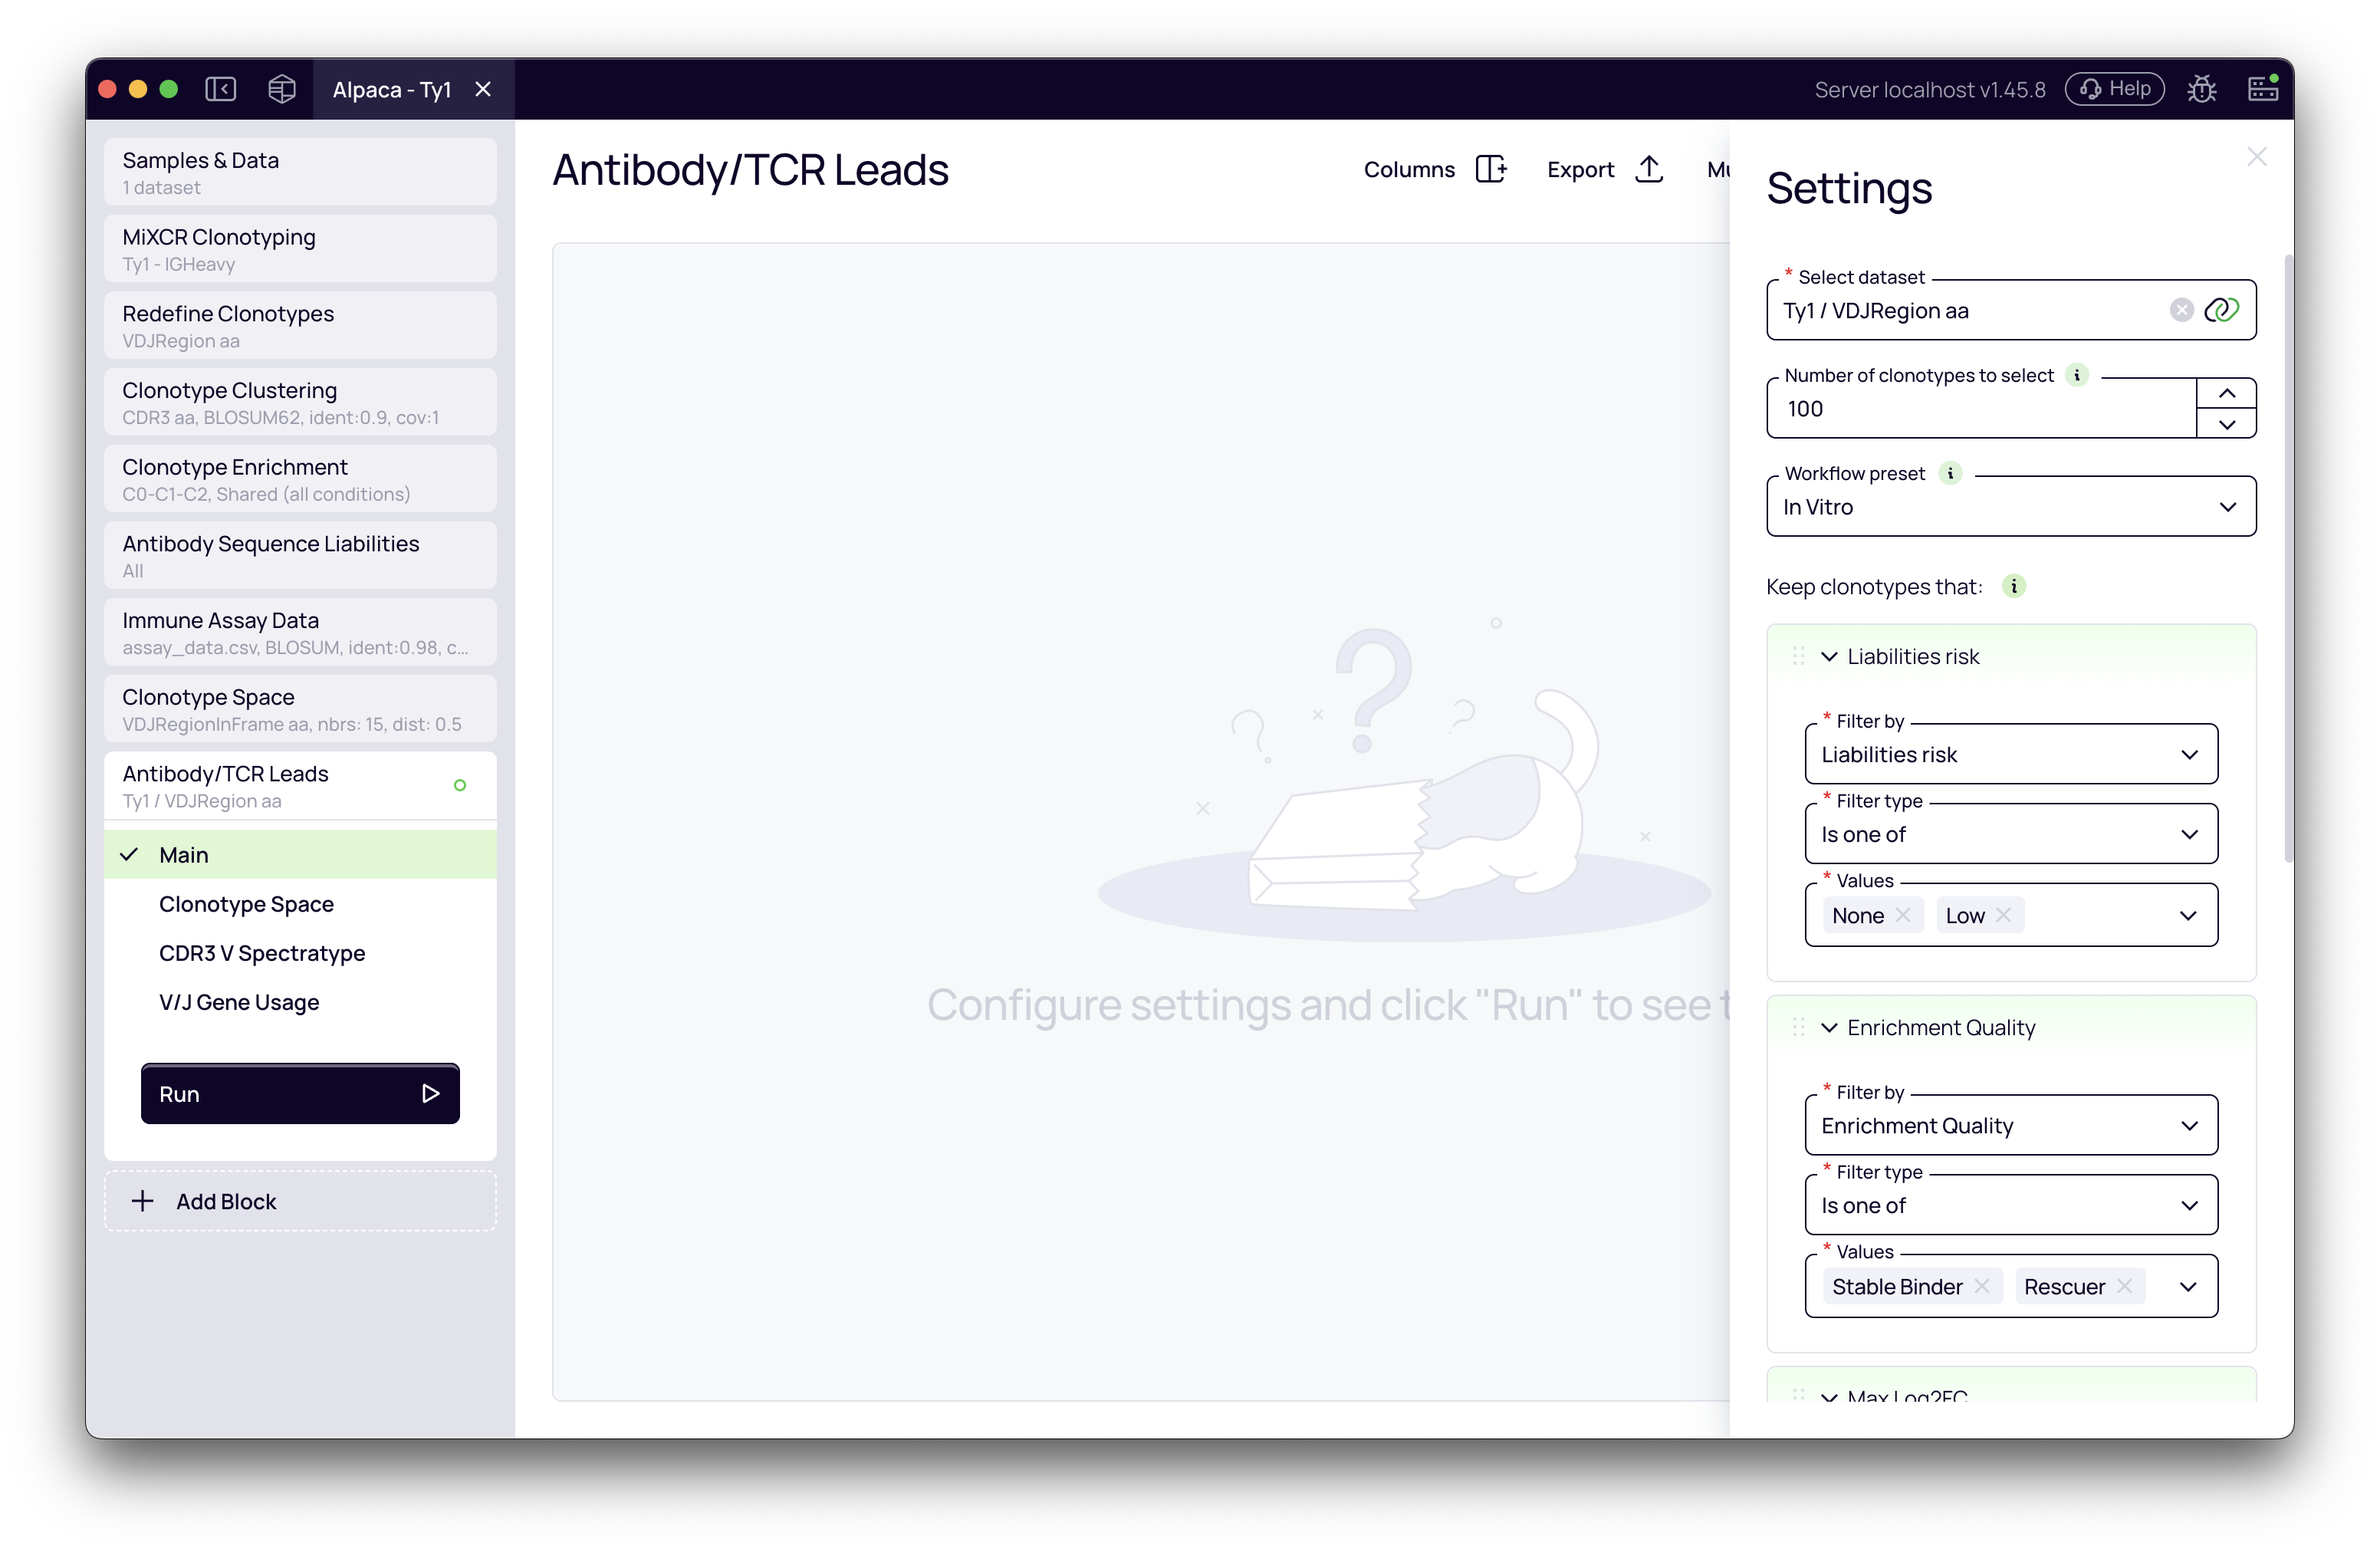
After the preset is applied, the Filters section will display all active filters. You can modify, add, or remove filters as needed for your specific selection criteria.
Understanding the "In Vivo Score"
When mutation columns are present in your data (from MiXCR's SHM analysis), the block offers a powerful composite ranking metric called "In Vivo Score".
This score combines three key indicators of antibody quality:
In Vivo Score = 0.40 × percentile(clonal frequency)
              + 0.35 × percentile(CDR mutation fraction)
              + 0.25 × percentile(nucleotide mutations)
Why this combination?
- Clonal frequency (40% weight): High-frequency clones indicate successful selection in the immune response
- CDR mutation fraction (35% weight): Mutations concentrated in CDRs indicate affinity-driven maturation, while framework-heavy mutations suggest structural instability
- Total mutations (25% weight): Evidence of germinal center experience, though near-germline antibodies can also be potent
The score uses percentile ranks (0.0 to 1.0) to normalize across different scales, ensuring fair weighting regardless of absolute values.
When to use In Vivo Score:
- Immunized animal studies (mouse, rabbit, llama, etc.)
- Natural infection or convalescent samples
- Any scenario where somatic hypermutation is a key quality indicator
When to use individual mutation columns instead:
- If you want to heavily filter on specific mutation thresholds (e.g., Nt mutations ≥ 5)
- If you disagree with the composite weights and prefer manual weighting via ranking order
Picking top candidates with diversified ranking
Your next goal is to select a final, smaller number of candidates for validation. The block uses a diversified ranking algorithm that balances ranking priorities with sequence diversity.
How diversified ranking works
The algorithm ensures diversity while respecting your ranking criteria:
-
Local Rank: For each group defined by your Diversification Column (e.g., each cluster), candidates are ranked independently. The best candidate in each group gets local rank 1, the second-best gets local rank 2, etc.
-
Global Sort: All candidates are then sorted by:
- Local rank (ascending) - all rank-1 candidates come first
- Then by your ranking criteria - within each rank tier, candidates are ordered by your specified metrics
-
Selection: The top N candidates are selected from this sorted list.
Example: If you select 50 leads with diversification by cluster:
- The algorithm first picks the best candidate from each cluster (all local rank = 1)
- If fewer than 50 clusters exist, it picks the second-best from each cluster (local rank = 2)
- And so on, ensuring broad coverage across the sequence space
Without diversification: The algorithm simply ranks all candidates globally and picks the top N, which may result in many similar sequences from a single dominant cluster.
Configure selection parameters
-
Number of leads to select: In the Clonotype Sampling section, enter the number of leads you want to select (e.g.,
50). -
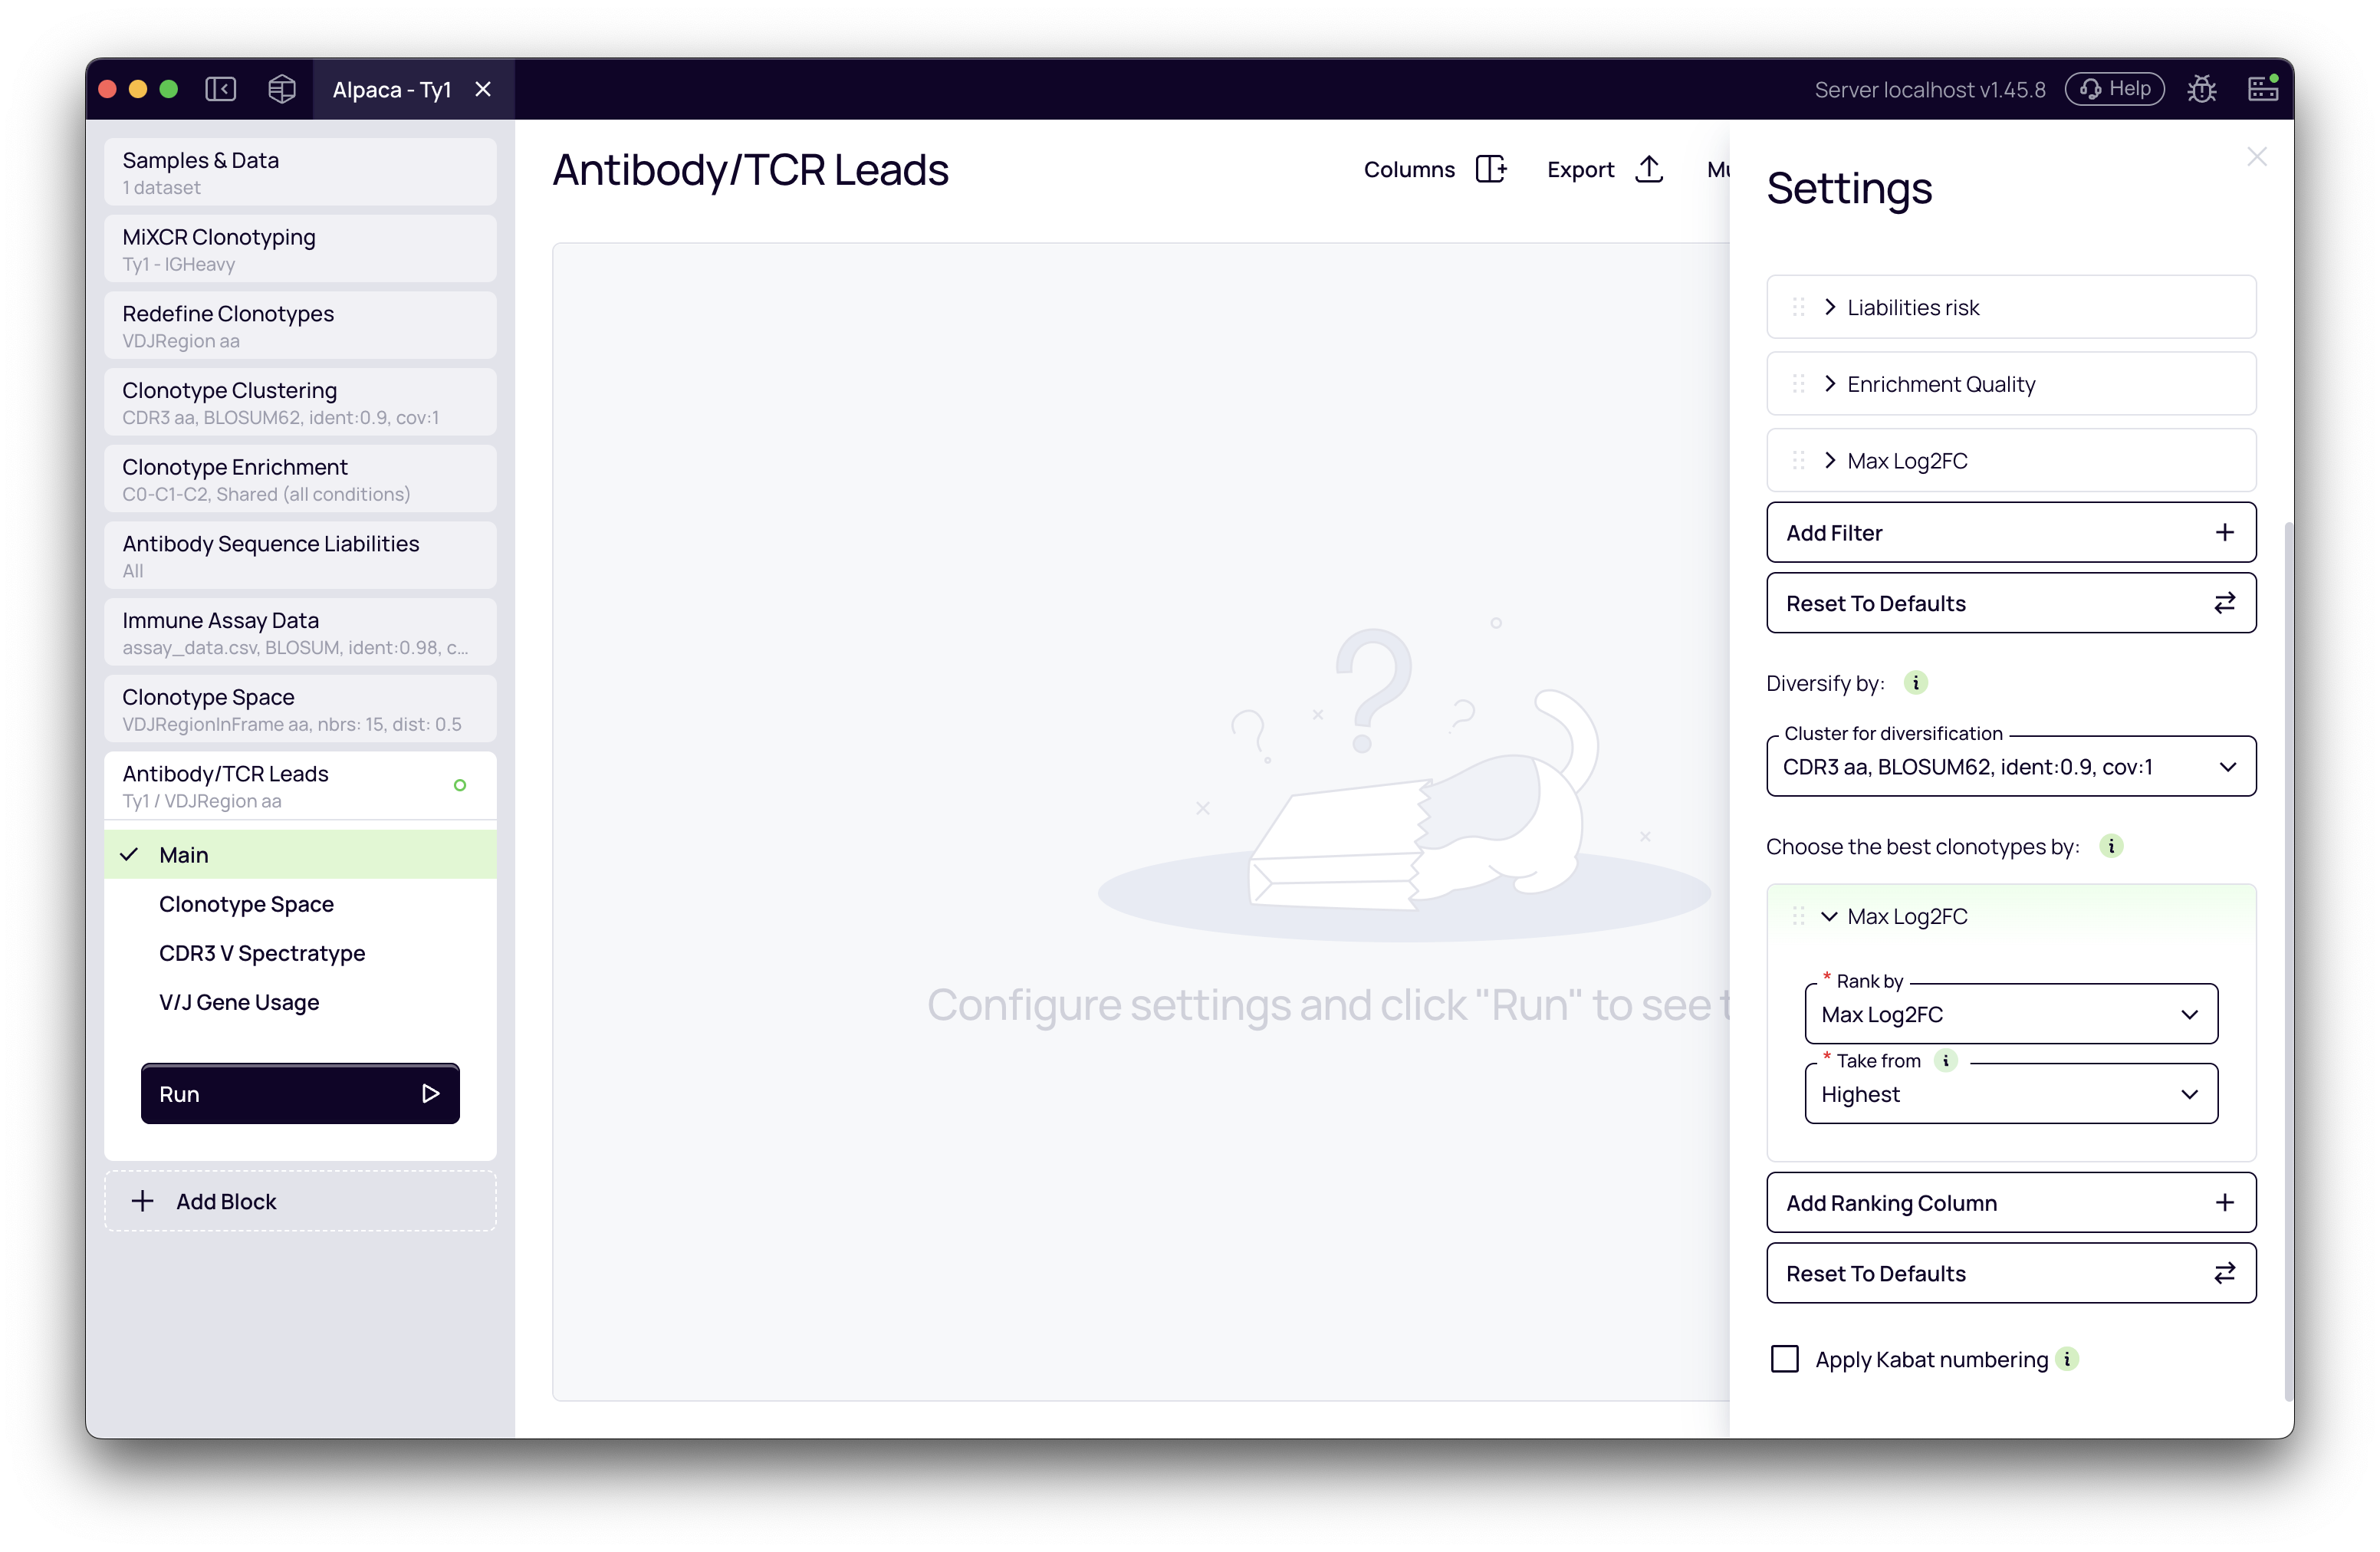
Diversification Column: Choose which grouping to use for ensuring diversity:
- Cluster Label: (Recommended) Ensures your selection includes representatives from many different antibody families
- No diversification: Allows the top N candidates to be selected even if they're all from the same cluster
- If multiple cluster columns are available (from different clustering blocks), you can choose which clustering to use
-
Define Ranking Criteria: In the Rank by section, define the parameters used to prioritize candidates within each diversity group. You can add multiple ranking columns.
- Default Ranking (In Vivo): "In Vivo Score"
- Default Ranking (In Vitro): "Max Enrichment"
- Adding Ranks: Click Add Ranking Column to add more criteria. For example:
- Rank by "In Vivo Score" first, then by "Distance to centroid" (ascending) to pick cluster representatives closest to the cluster center
- Rank by "Max Enrichment" first, then by secondary metrics to break ties among highly enriched candidates
- Combine filters (Binding Specificity, Enrichment Quality) with Max Enrichment ranking for high-confidence, target-specific leads
Analyzing and visualizing the selected leads
Once the selection process is complete, the block provides several tabs for visualizing and validating your selection.
Main table
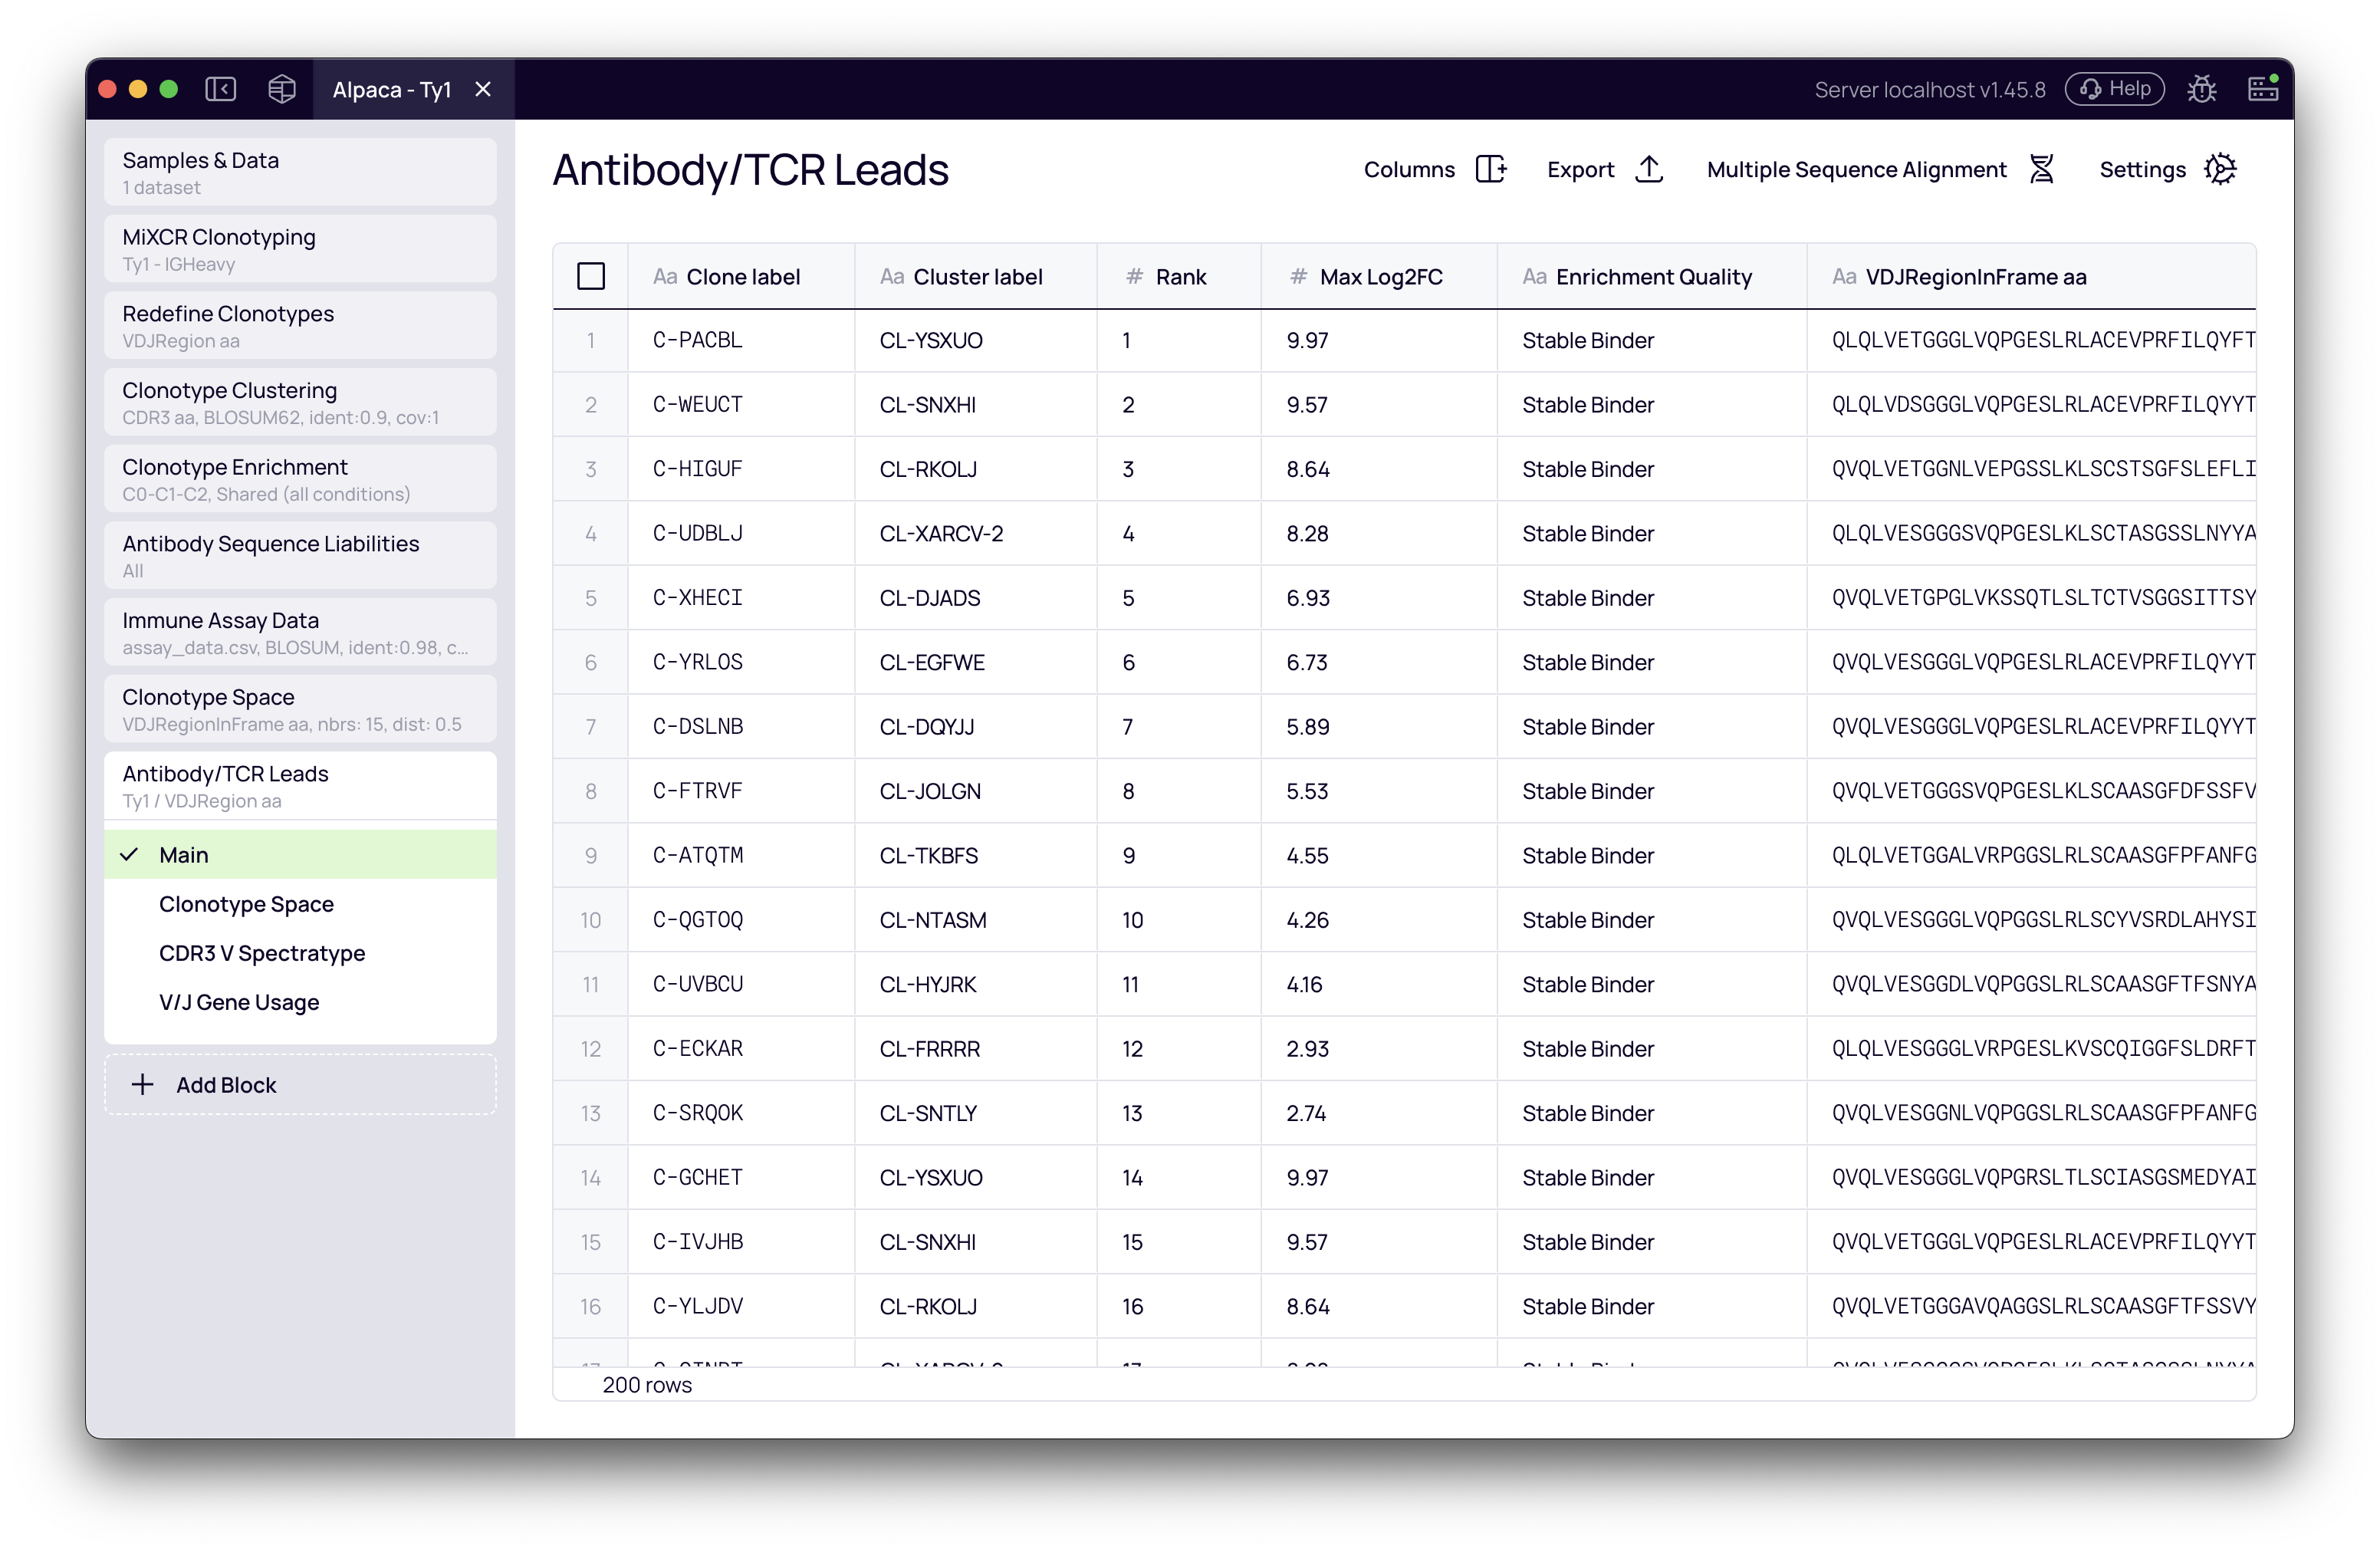
The main table shows your final list of selected candidates (e.g., 50 leads) with all associated data. Key columns to review:
- Ranking metrics: The columns you selected for ranking (e.g., In Vivo Score, Max Enrichment, Enrichment Quality, Binding Specificity)
- Mutation metrics (In Vivo workflows): Nt mutations, AA mutations (CDR), AA mutations (FWR), CDR mutation fraction
- Enrichment metrics (In Vitro workflows): Max Enrichment, Enrichment Quality, Binding Specificity (when antigen controls are configured)
- Cluster Label: Which sequence family each lead represents
- Sequence columns: Full VDJ sequences, CDR3 sequences
- Liabilities risk: Developability assessment
Use the Columns manager to show/hide columns and the Export button to download your lead list for ordering synthesis.
Clonotype space
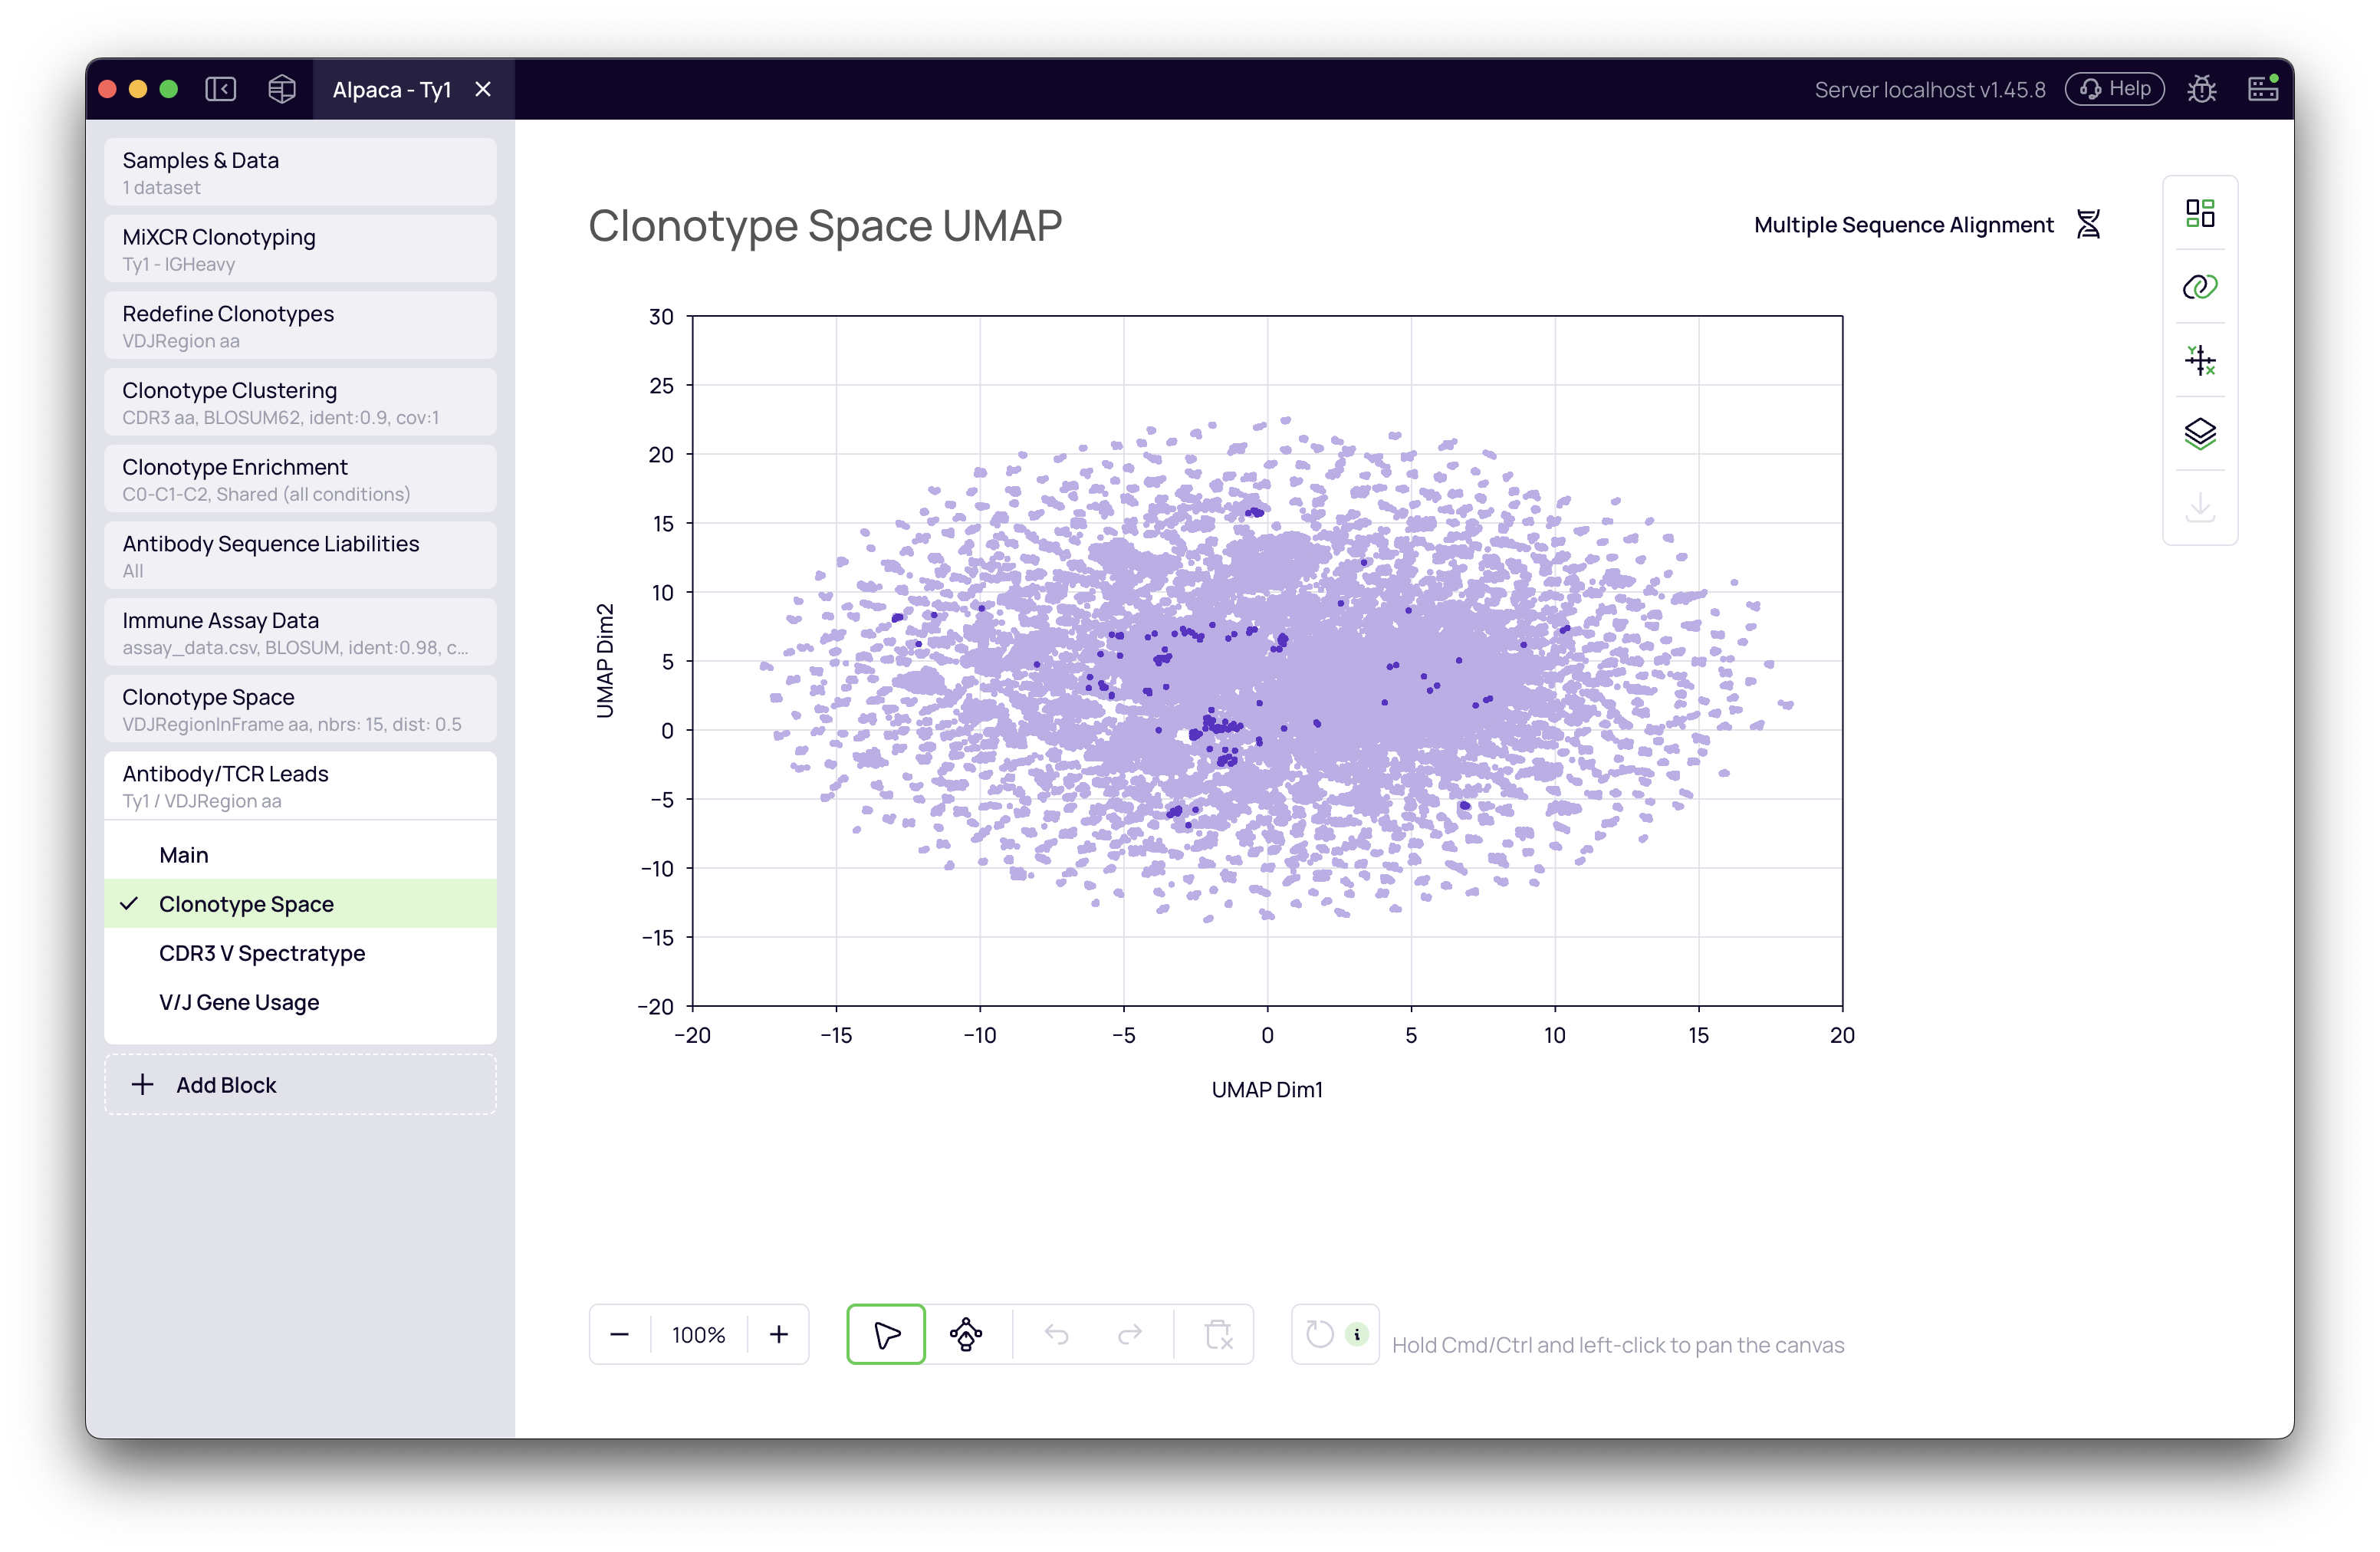
This tab displays the same UMAP visualization from the upstream Clonotype Space block but automatically highlights your selected candidates. This is a crucial view for confirming that your antibody leads are distributed across the repertoire and not concentrated in a single, similar region.
What to look for:
- Broad coverage: Selected leads (highlighted) should be distributed across different regions of the UMAP
- Avoiding over-representation: No single cluster should dominate your selection unless it's truly the best by your ranking criteria
Multiple sequence alignment
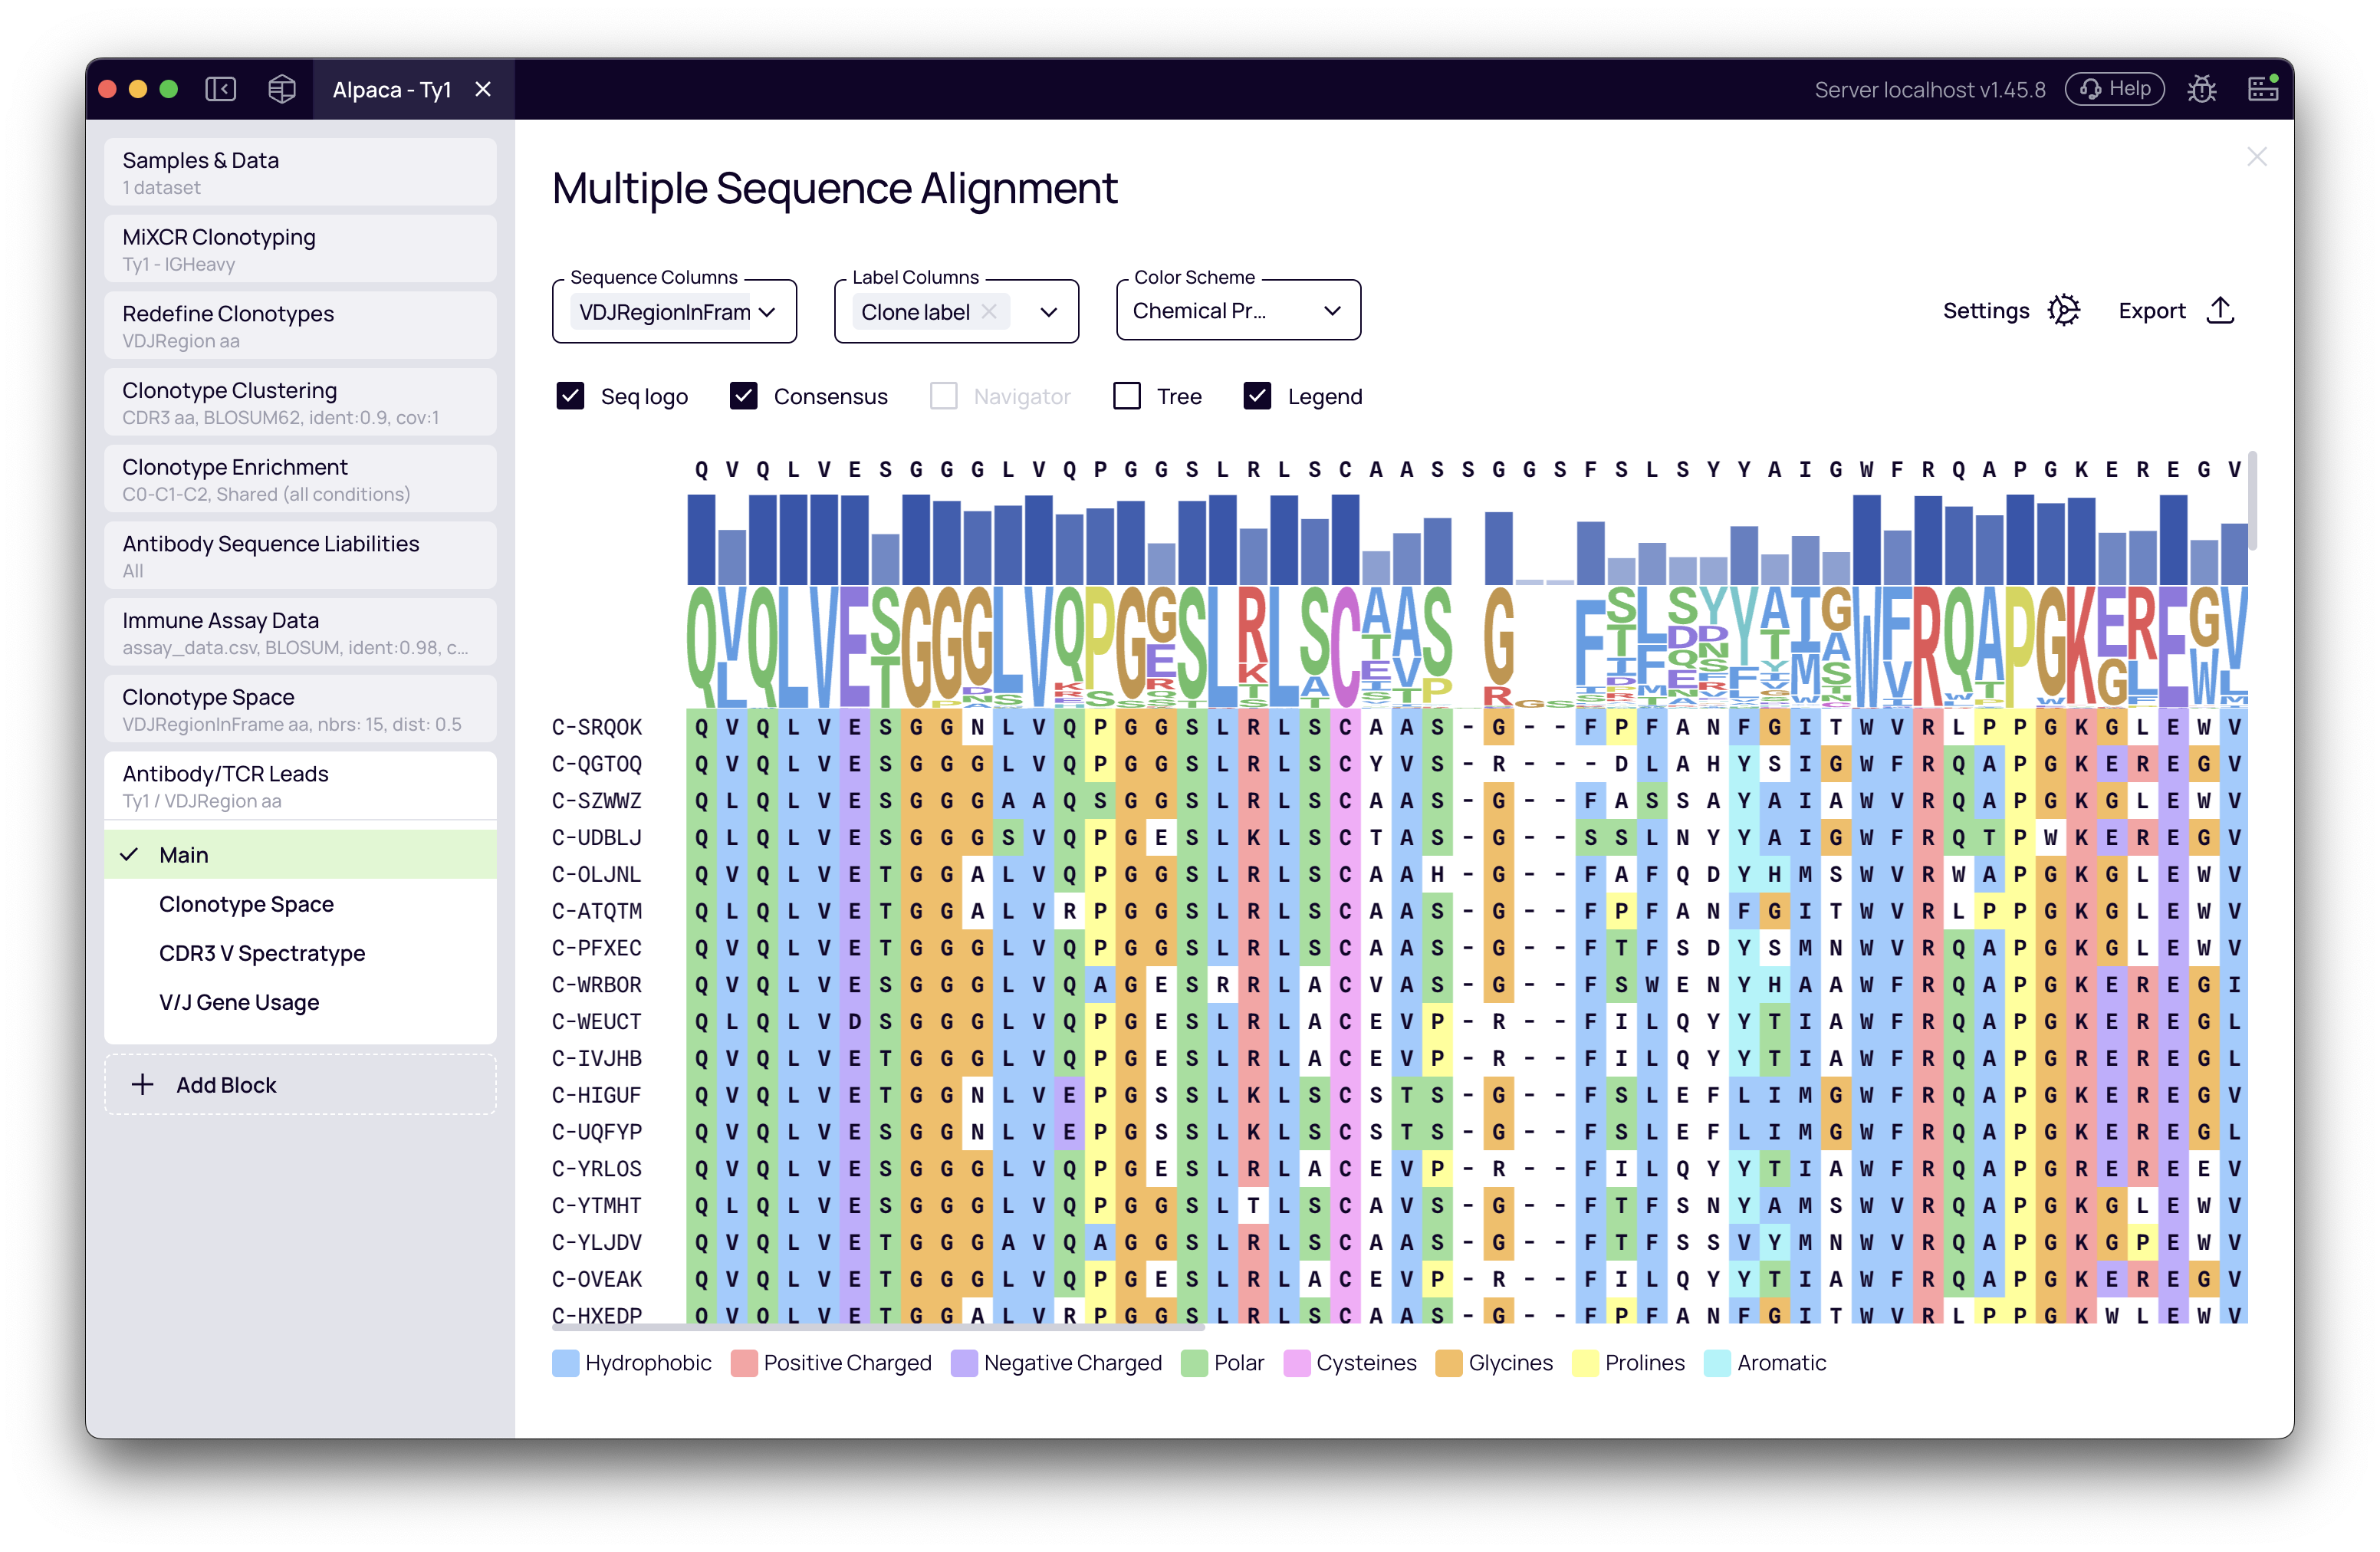
This view generates a sequence alignment of your selected leads (e.g., for the VDJRegionInFrame sequence). It serves as a direct visual confirmation of their sequence diversity.
Features:
- Color by Chemical Properties to identify conserved vs variable regions
- Highlight CDRs and Frameworks to see where diversity is concentrated
- Customize which sequences and labels are shown
- Use the phylogenetic tree view to understand relationships between your selected leads
Spectratype and gene usage
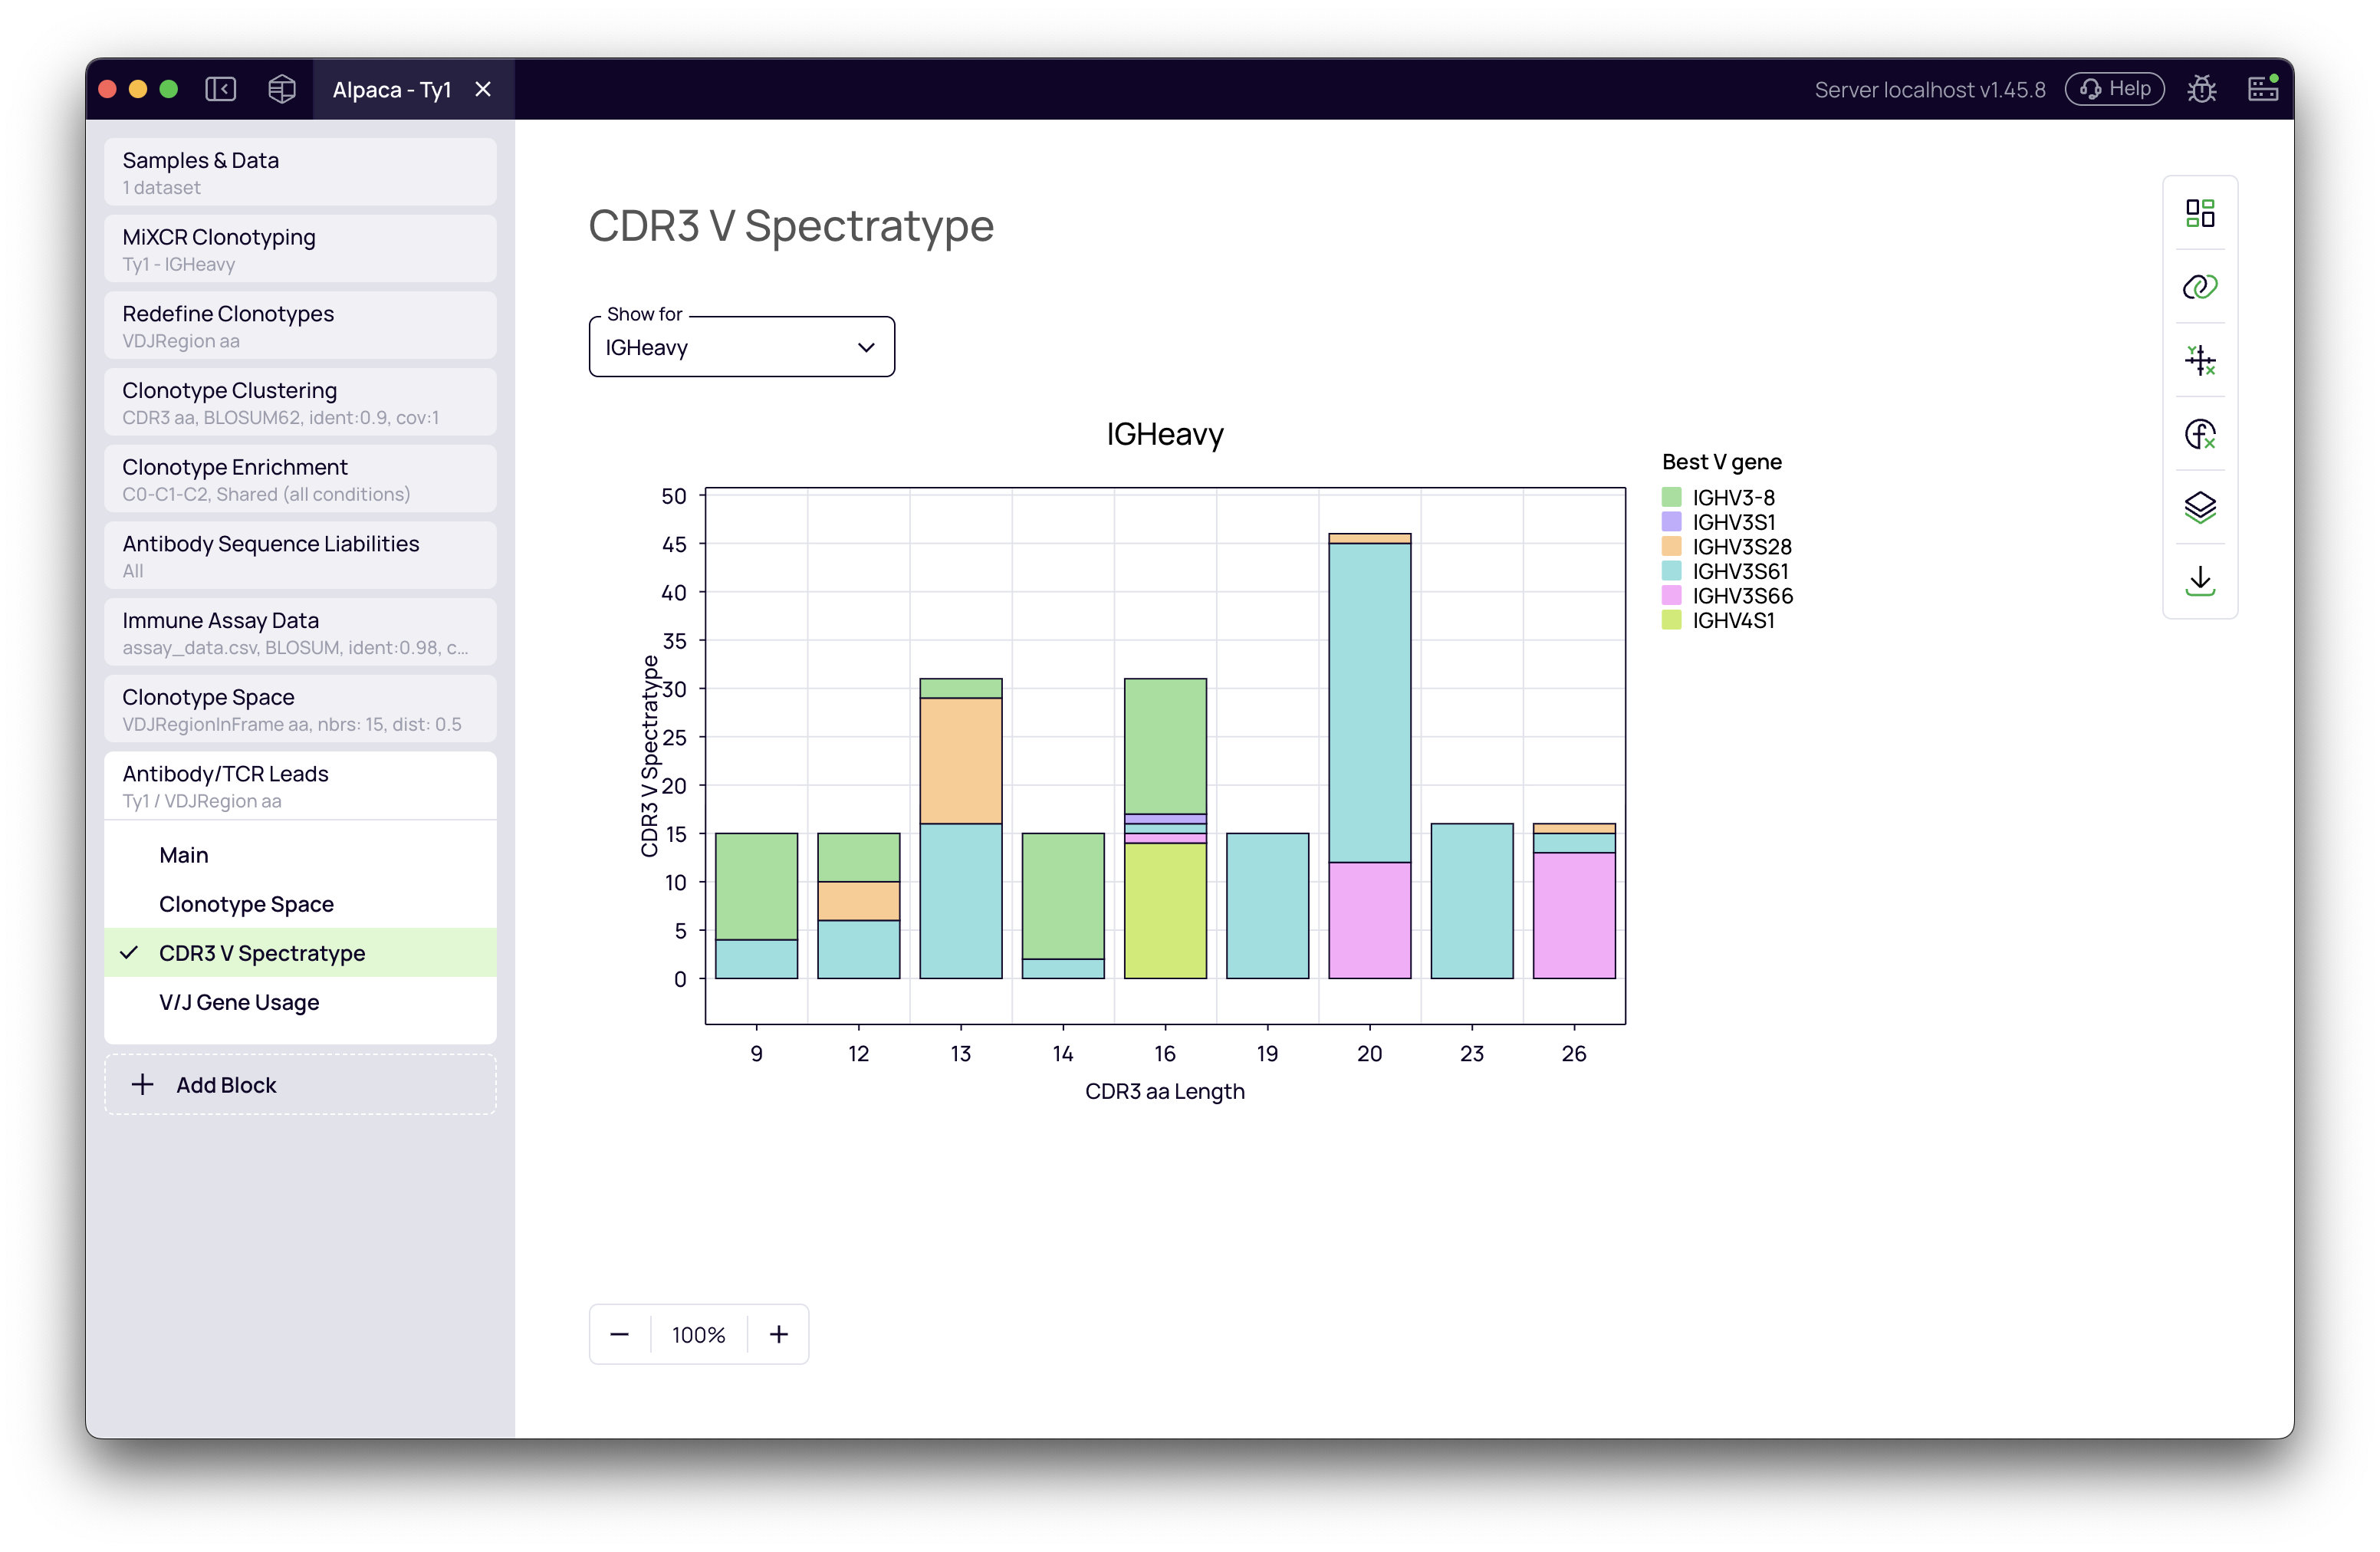
These plots show the distribution of CDR3 lengths and V/J gene usage for your selected antibody leads.
What to look for:
- Diverse spectratype: A broad distribution of CDR3 lengths indicates structural diversity
- Multiple gene families: Usage of different V and J genes suggests your selection isn't biased toward a single germline origin
- Warning signs: A highly skewed plot (single peak, single gene) might indicate insufficient diversity, which could mean you need to adjust your diversification settings or select more leads
Best practices and tips
For in vivo discovery workflows
- Start with preset defaults: The In Vivo preset provides validated filtering and ranking criteria
- Monitor mutation quality: Use CDR mutation fraction > 0.5 to avoid framework-heavy clones
- Don't over-filter on mutations: Near-germline antibodies can still be potent; the composite score already balances this
- Select enough leads: For a diverse panel, aim for at least 50-100 leads to represent the sequence space
For in vitro display workflows
- Verify enrichment thresholds: The default 1.0 log₂ fold change is a good start, but adjust based on your panning stringency
- Use antigen specificity analysis: When the Clonotype Enrichment block is configured with target and control antigens:
- Filter by Binding Specificity to select target-specific binders that show minimal binding to control antigens
- Filter by Enrichment Quality to remove low-confidence hits with inconsistent enrichment patterns
- Rank by Max Enrichment to prioritize the most highly enriched candidates
- These metrics help eliminate non-specific binders and low-quality enrichment signals
- Combine with functional data: If you have ELISA or binding data (via the Functional Assay Data block), add it as a ranking criterion
- Consider multiple rounds: Rank by final-round enrichment first, then by earlier rounds to find consistent binders
General tips
- Use diversification: Always enable diversification by cluster unless you specifically want to allow multiple similar sequences
- Iterate quickly: Use a small number (e.g., 20 leads) for initial visualization, then increase once you're confident in the settings
- Check the UMAP: The Clonotype Space visualization is the fastest way to verify diversity
- Export and track: Download your lead table with all metadata for reproducibility
By combining preset-specific defaults, the composite In Vivo Score, diversified ranking, and integrated visualizations, you can quickly and confidently move from a large pool of potential antibodies to a refined, high-quality list of candidates ready for the next stage of discovery.