Importing Preprocessed Data
While Platforma is powerful at processing raw sequencing data, you might already have clonotype tables generated from other tools like MiXCR, ImmunoSEQ, Cell Ranger or a custom formatted table. Platforma makes it easy to import this pre-processed data, allowing you to jump directly to downstream analysis and visualization.
This guide walks you through importing clonotype tables in various formats, configuring the import, and using the data in downstream analysis blocks.
You can also watch the full video tutorial here:
Create a Project and Prepare Datasets
First, we need to create a project and upload our pre-processed data files into distinct datasets within the Samples & Data block.
- Log into Platforma and click Create New Project. Give it a descriptive name, like Import from TSV.
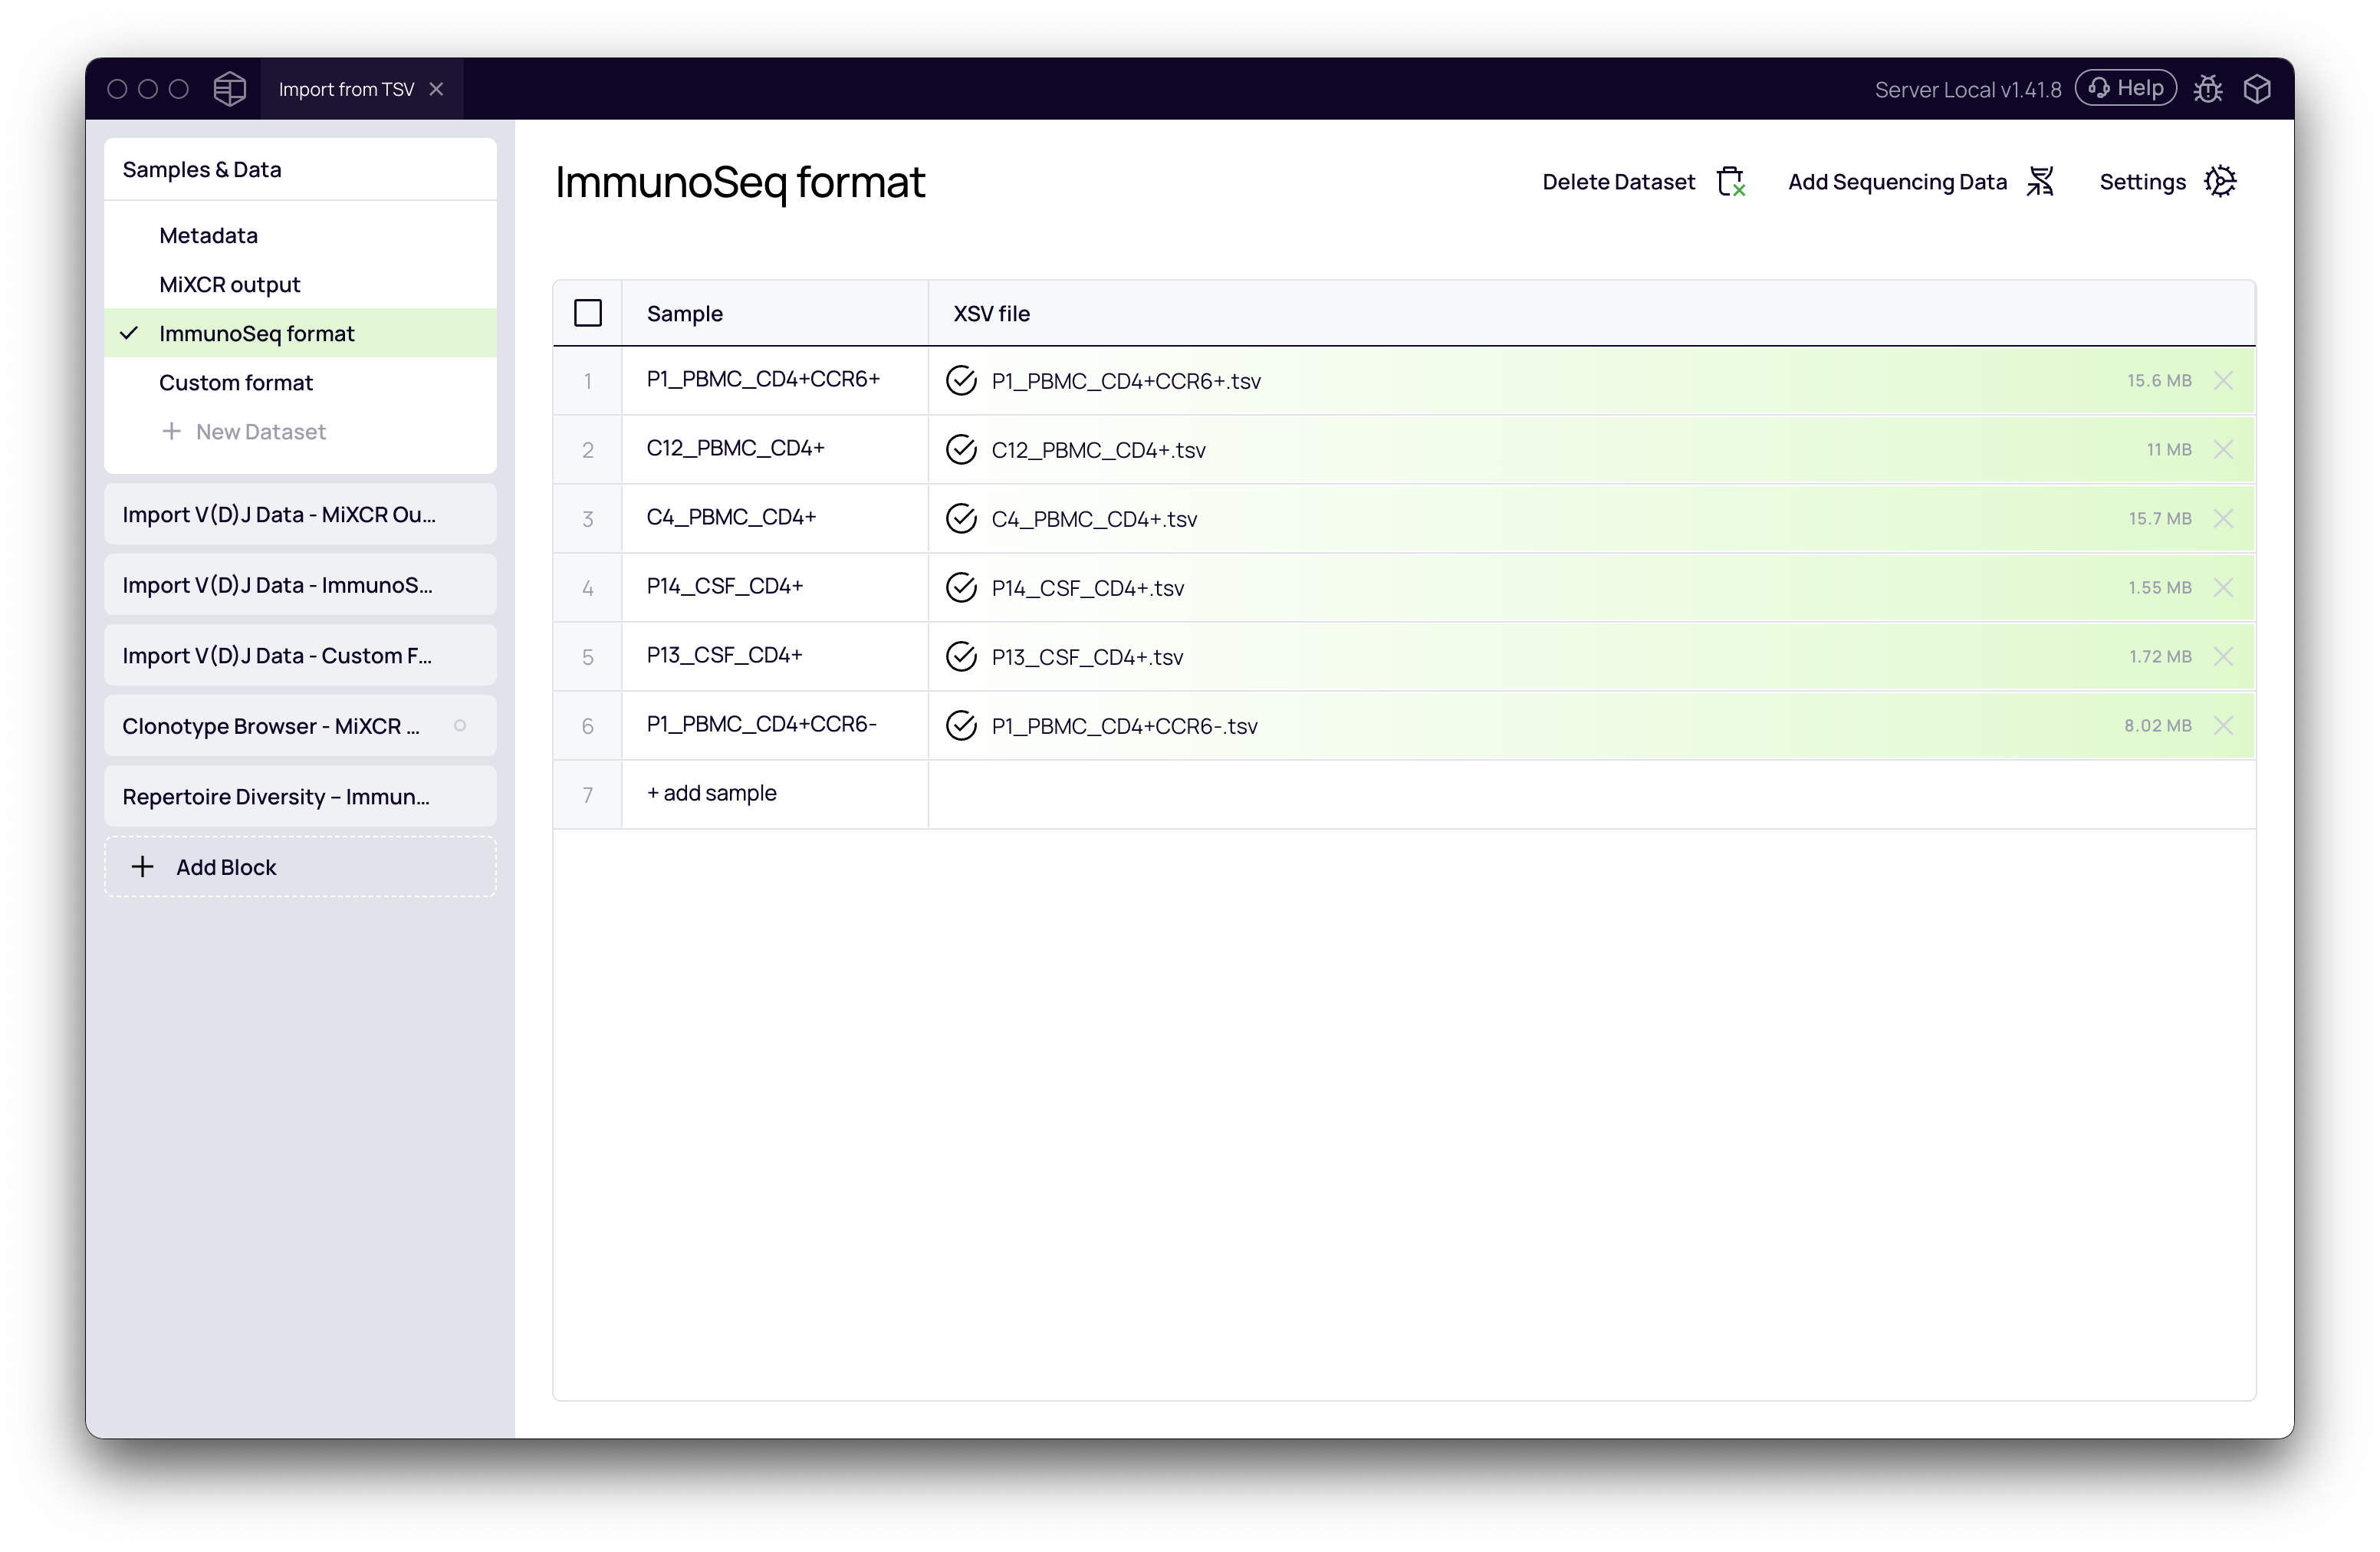
- In the Samples & Data block, click + New Dataset to create your first dataset.
- Select your clonotype table file(s). In this example, we will create three separate datasets for different formats:
- A single MiXCR output file (
.tsv). - Multiple ImmunoSEQ output files (
.tsv). - A single file in a custom table format (
.tsv).
- A single MiXCR output file (
- For each set of files, give the dataset a clear name (e.g., MiXCR output, ImmunoSeq format, Custom format). Platforma will automatically parse the filenames to create sample entries.
- After creating all your datasets, click the Run button to finalize the file upload.
Import Clonotype Tables with the Import V(D)J Data Block
With the files uploaded, the next step is to use the Import V(D)J Data block to parse the tables and load them into Platforma's standardized format. You will add a separate instance of this block for each dataset you want to import.
- Click Add Block and search for Import V(D)J Data. Click to add it to your project.
- In the settings panel on the right, you will configure the import for your first dataset.
Importing Standard Formats (MiXCR, ImmunoSEQ)
For common formats, Platforma has built-in presets that automatically map the correct columns.
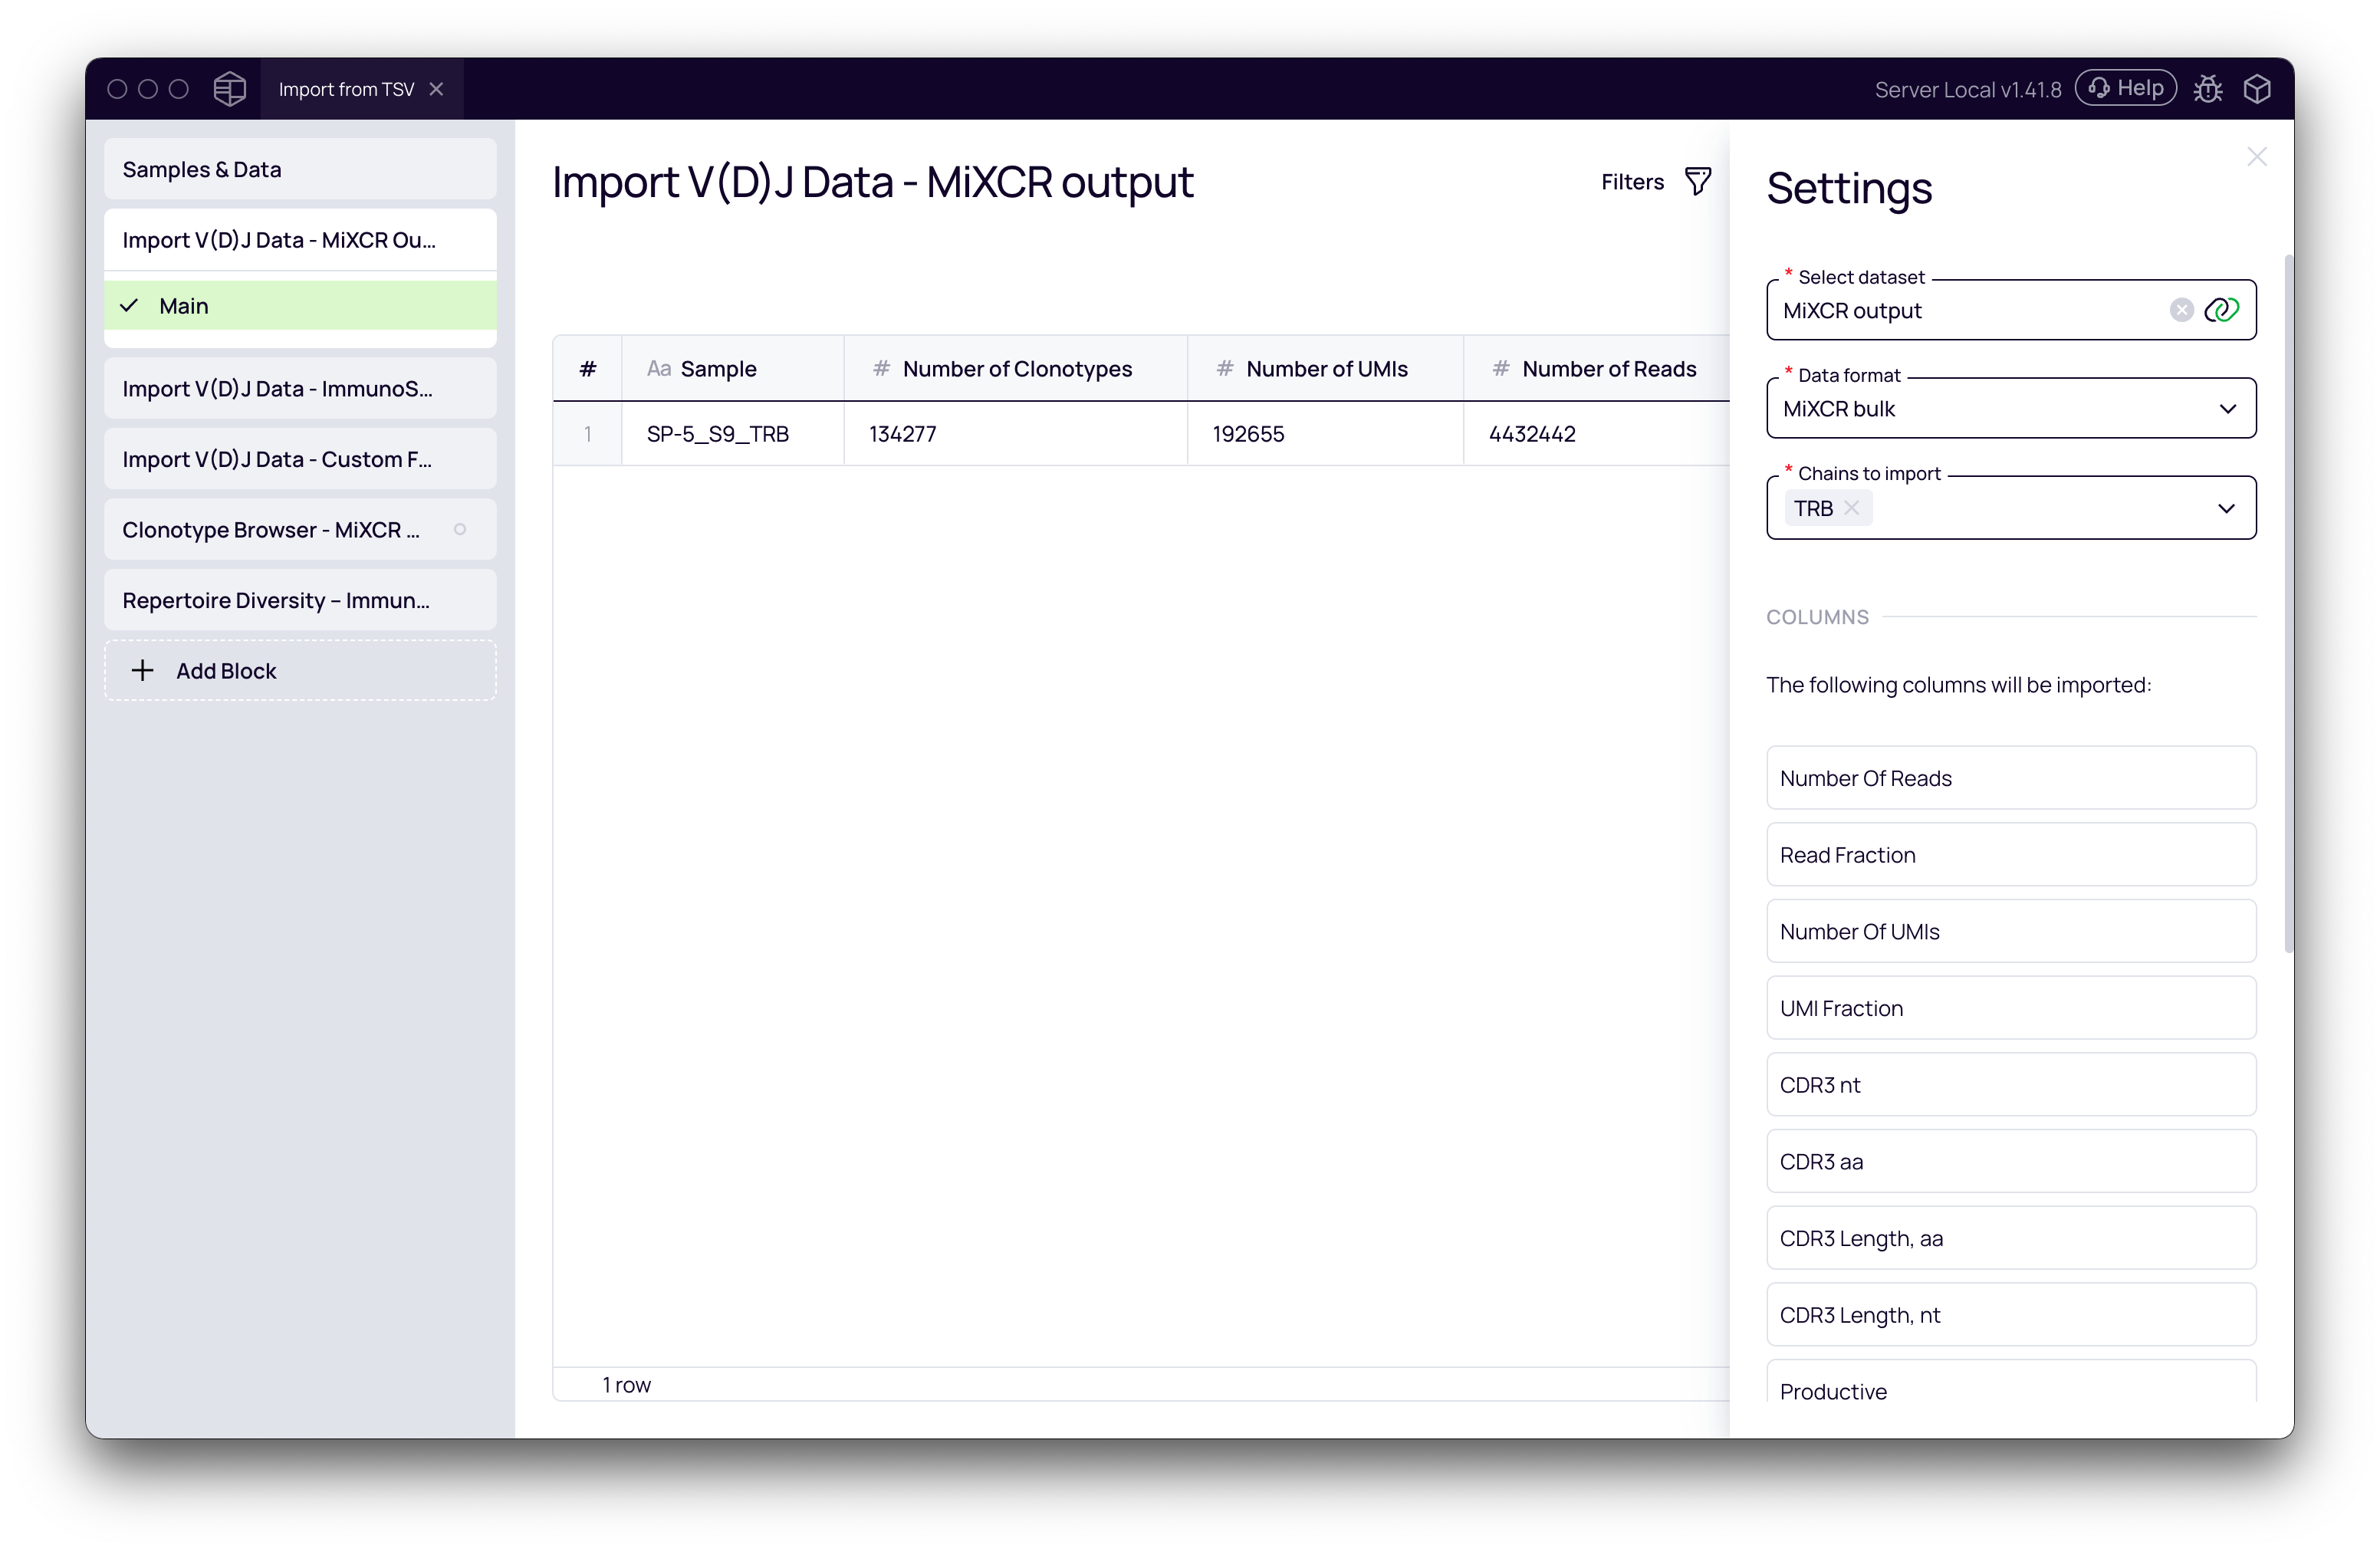
- Select dataset: Choose your dataset from the dropdown (e.g., MiXCR output).
- Data format: Select the appropriate data format (e.g., MiXCR bulk). The block will preview the columns it expects to import.
- Chains to import: Select the T- or B-cell chains you want to analyze (e.g., TRB).
- Click Run. The block will process the file and display summary statistics (Number of Clonotypes, UMIs, Reads).
Repeat this process for your other standard-format datasets, such as ImmunoSEQ format.
Importing a Custom Format
If your data doesn't match a built-in format, you can manually map the columns.
- Add another Import V(D)J Data block.
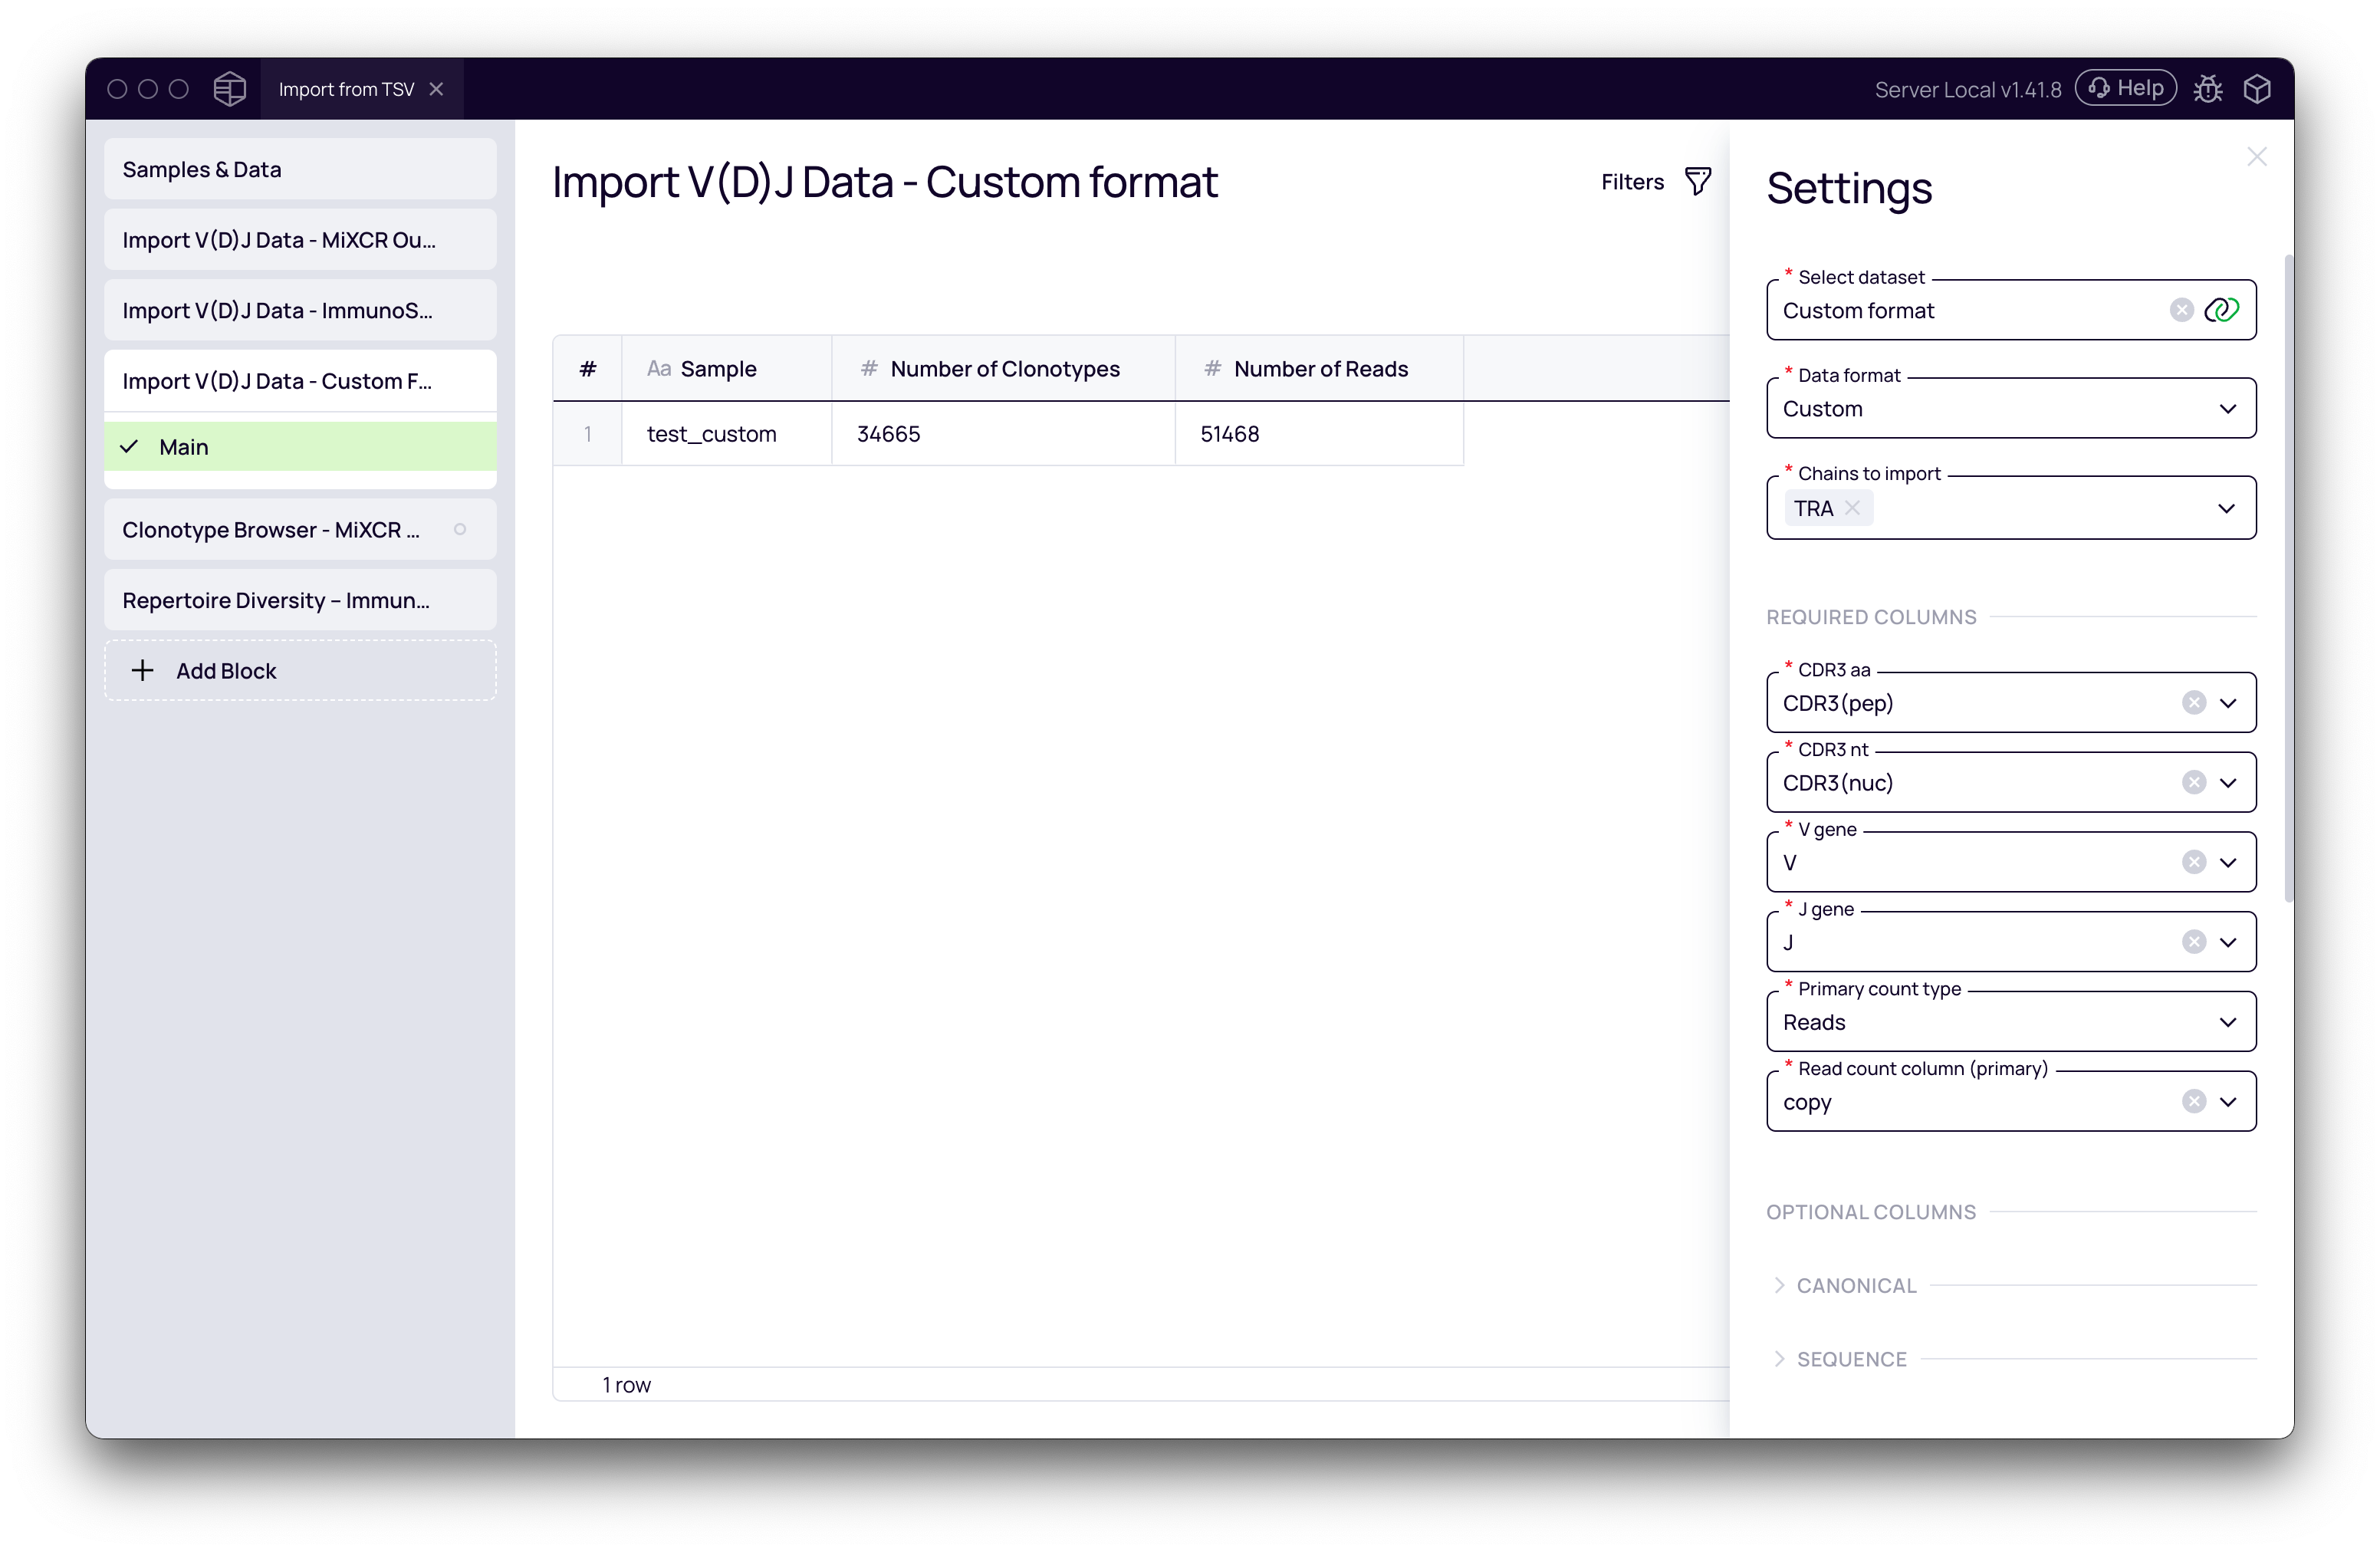
- Select your custom dataset (e.g., Custom format).
- Set the Data format to Custom. This will reveal the column mapping interface.
- Crucially, you must map the essential columns from your file to Platforma's required fields:
CDR3.aa: The amino acid sequence of the CDR3 region.CDR3.nt: The nucleotide sequence of the CDR3 region.V.gene: The V-gene name.J.gene: The J-gene name.Primary count type: The unit of measurement (e.g.,ReadsorUMIs).Read count column (primary): The column in your file containing the clone counts.
- You can also map optional columns for V(D)J regions, sequences, and mutations if they are present in your table.
- Click Run to import your custom-formatted data.
To successfully import a custom table, it must contain, at a minimum: the CDR3 amino acid and nucleotide sequences, V and J gene assignments, and a column with the count/abundance for each clonotype in either reads or UMIs.
Verify and Analyze Imported Data
Once your data is imported, it behaves exactly like data processed from raw FASTQ files within Platforma. You can now connect it to any downstream analysis or visualization block.
Exploring with Clonotype Browser
A great first step is to inspect your imported data.
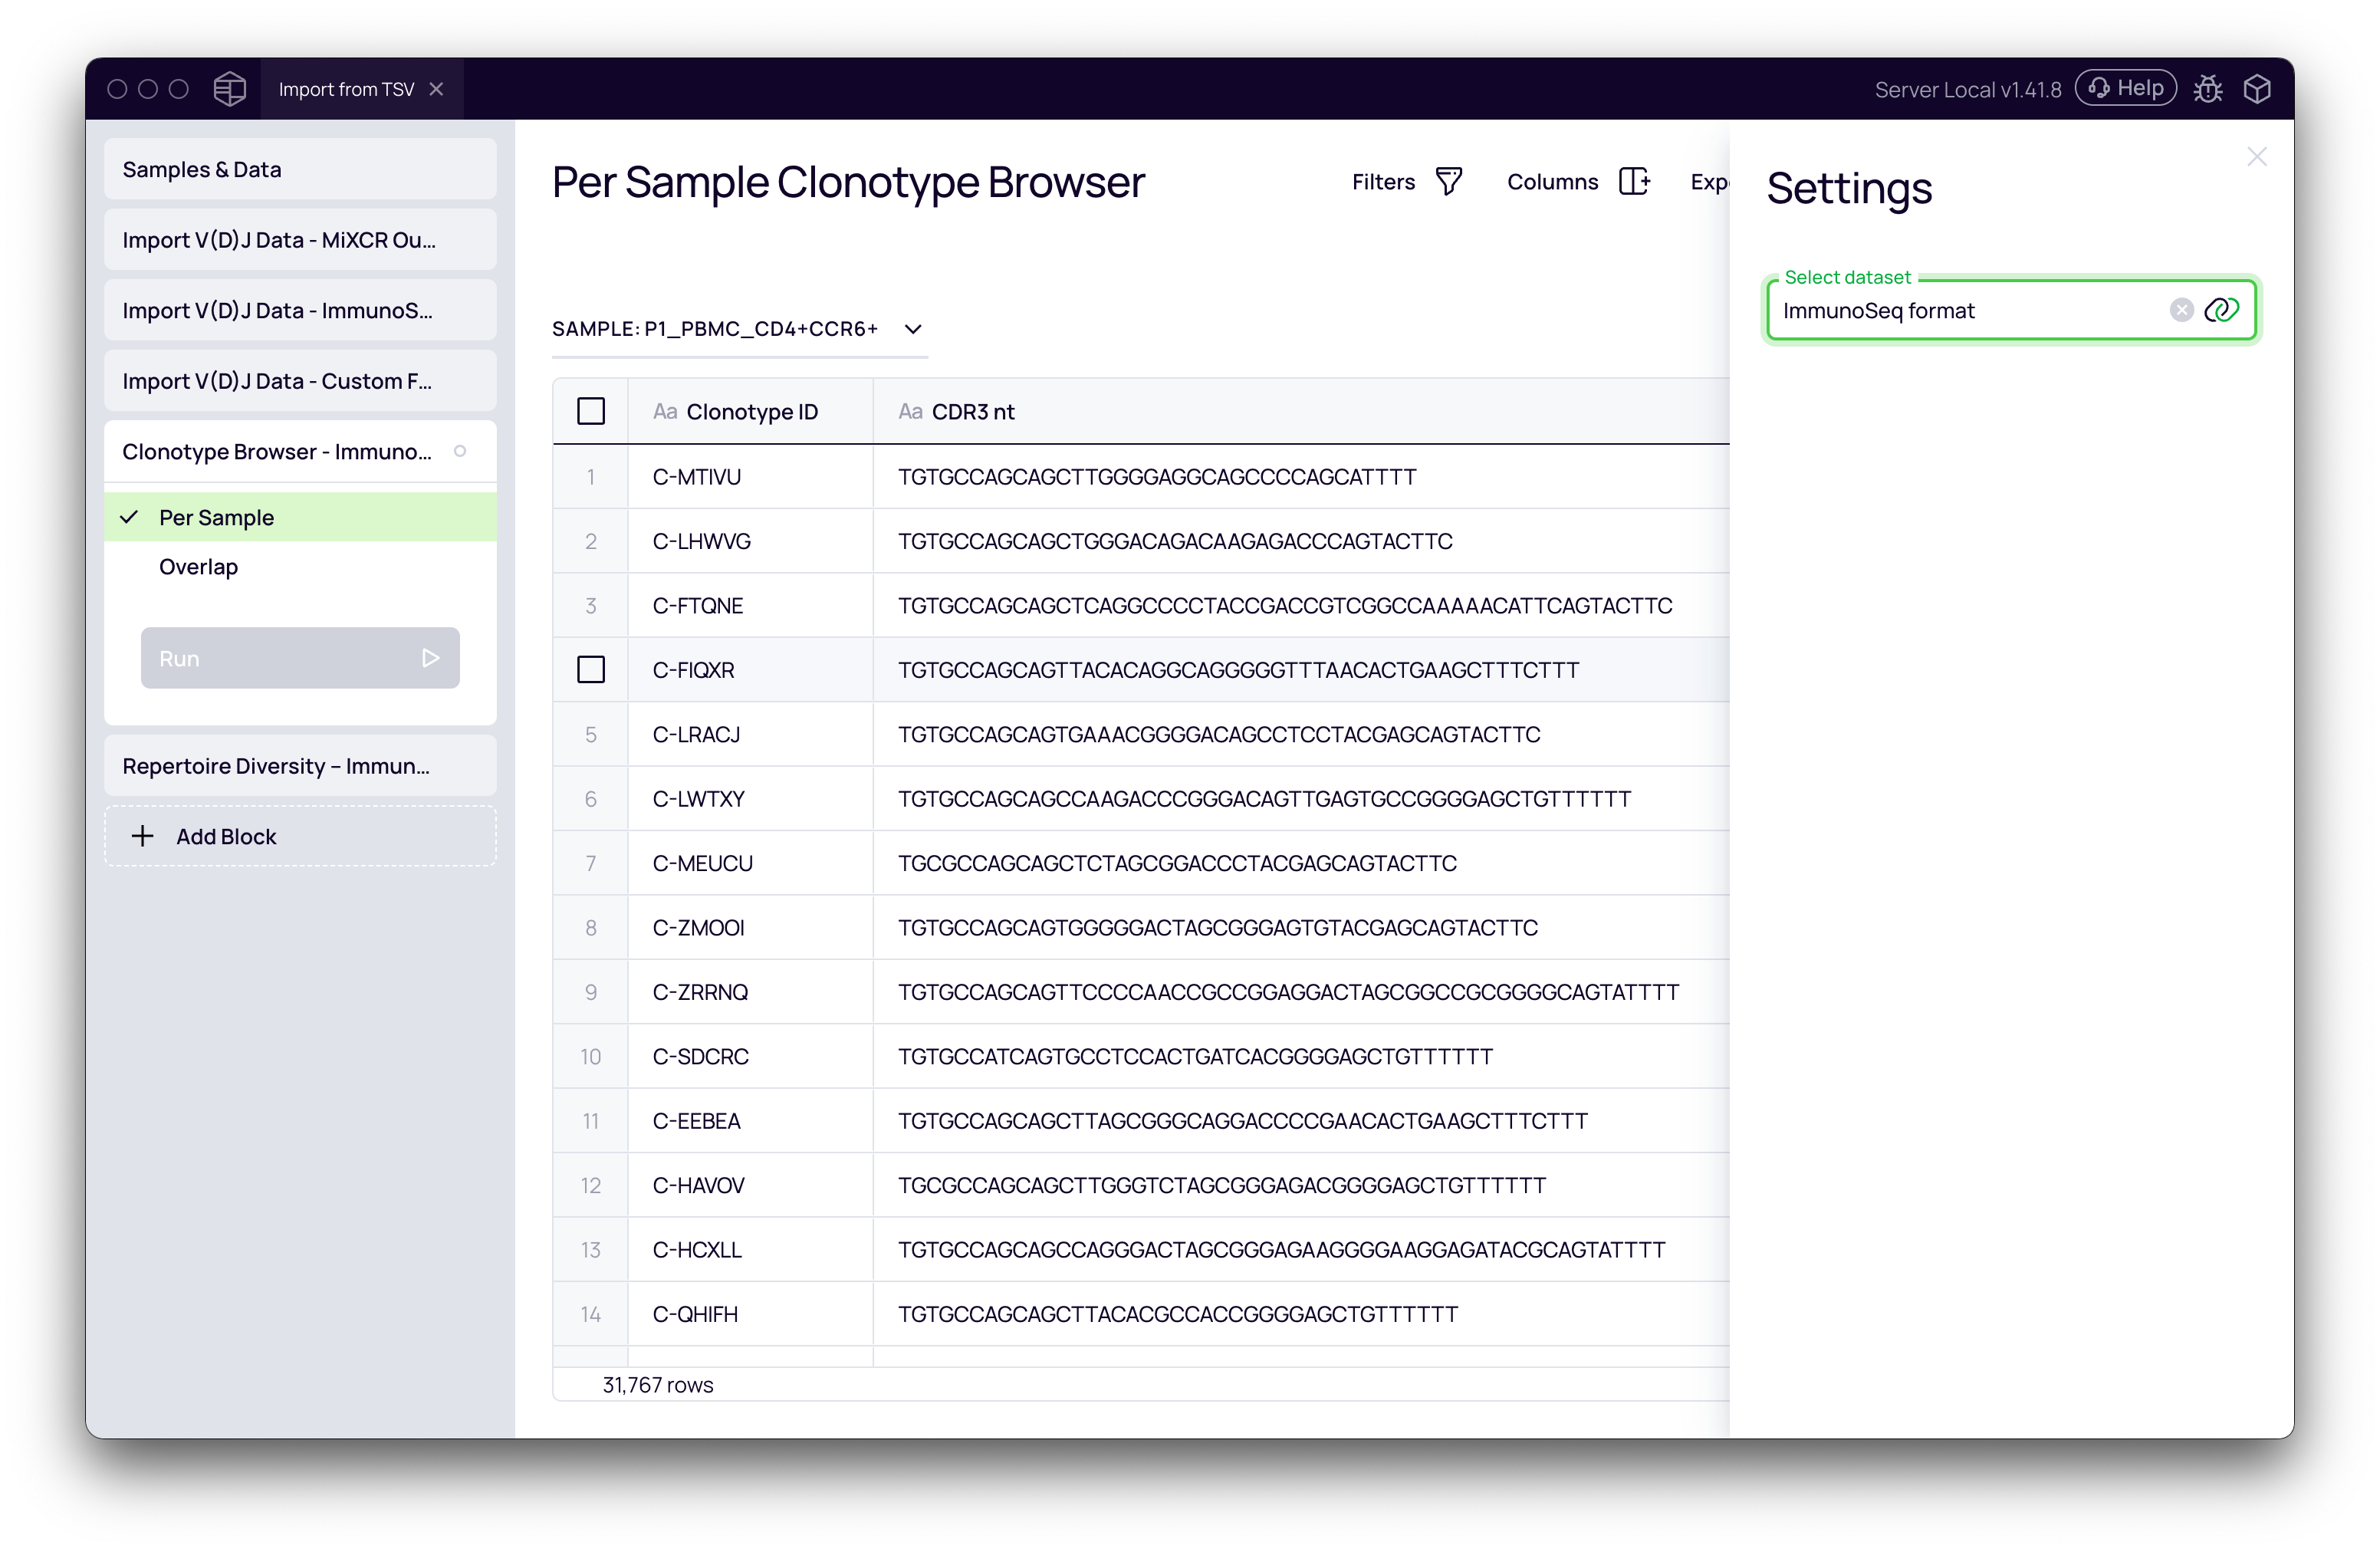
- Click Add Block and select Clonotype Browser.
- In the settings panel, use the Select dataset dropdown to switch between your imported datasets (MiXCR output, ImmunoSeq format, etc.).
- The main view will display the full clonotype table, allowing you to sort, filter, and verify the data.
Calculating Repertoire Diversity
You can immediately perform analyses. For example, to calculate diversity metrics:
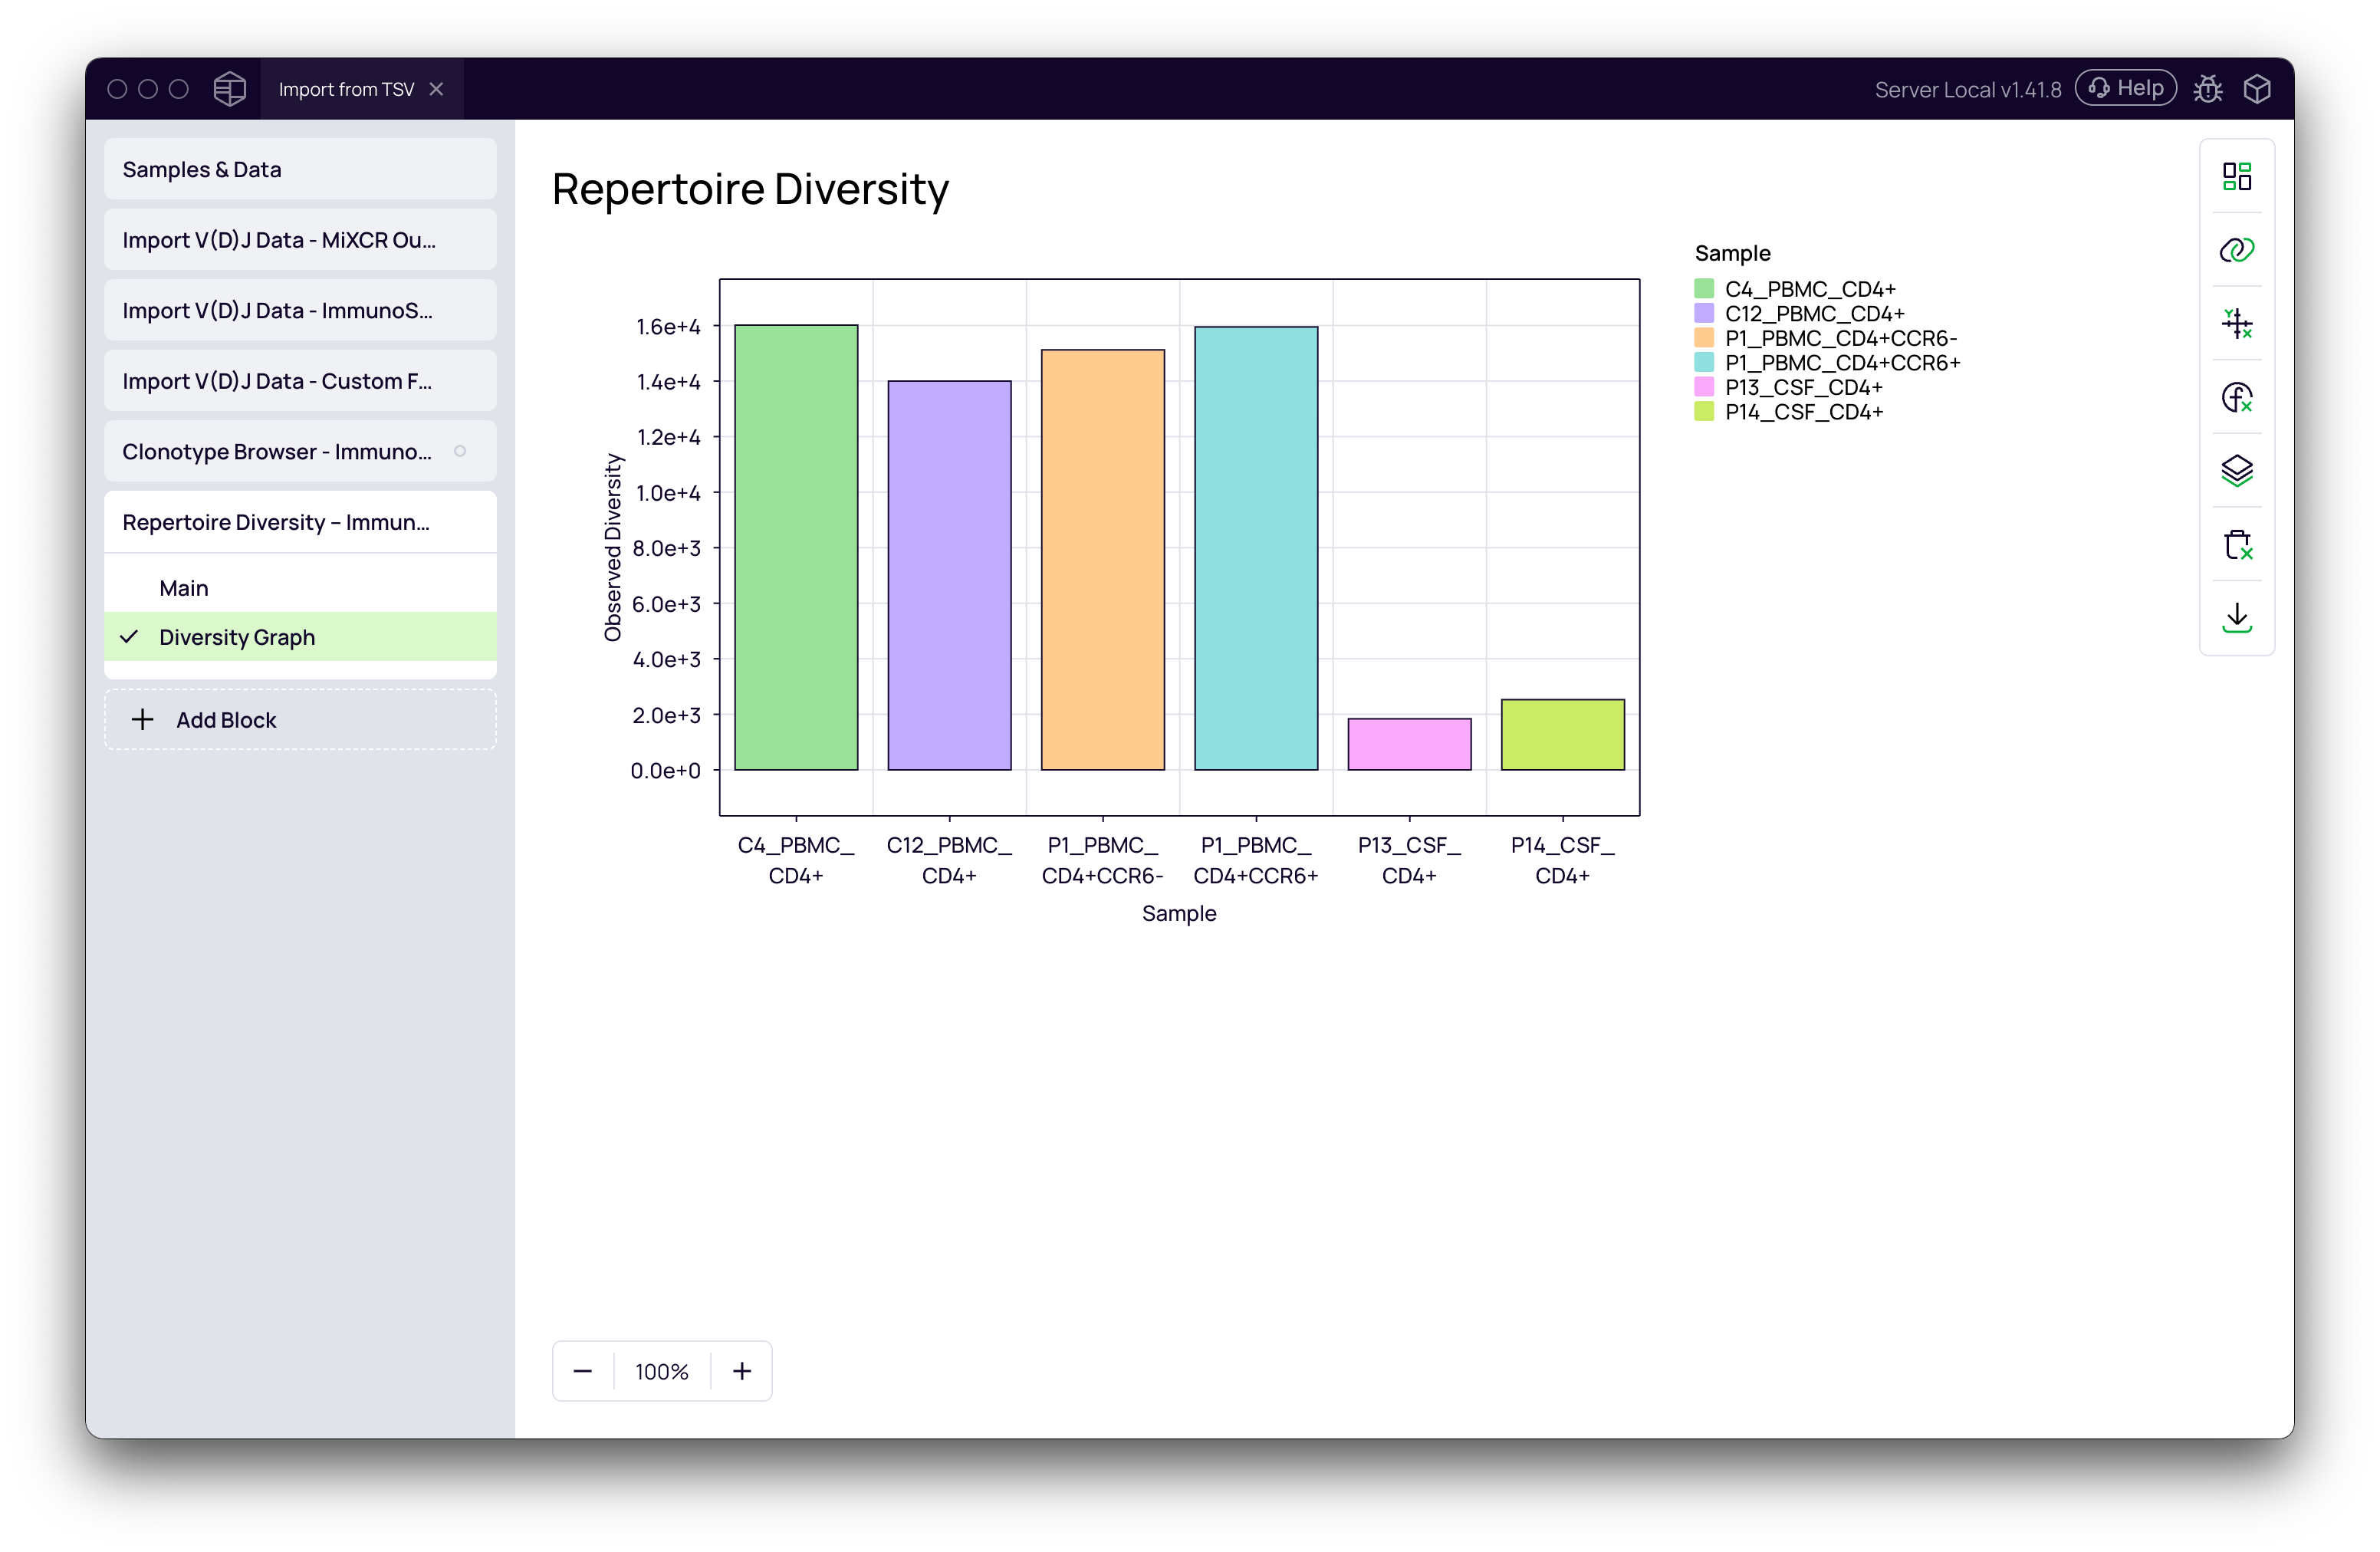
- Click Add Block and select Repertoire Diversity.
- In the settings, select one of your imported datasets as the input.
- Click Run. The block calculates several diversity indices for each sample.
- Switch to the Diversity Graph tab to visualize the results as a bar chart, box plot, or other chart type.
Next Steps
Congratulations! You have successfully imported pre-processed clonotype data into Platforma. This data is now fully integrated and ready for any downstream analysis.