Rarefaction
When analyzing immune repertoires, a key goal is to compare the number of unique clonotypes—the clonal richness—across different samples. However, a common challenge is that samples are often sequenced to different depths. A sample with more sequencing reads will, by chance alone, likely reveal more unique clonotypes, making a direct comparison of richness misleading. This is like comparing the variety of colored candies in a small bag versus a large jar; the jar will almost certainly have more colors simply because it contains more candies.
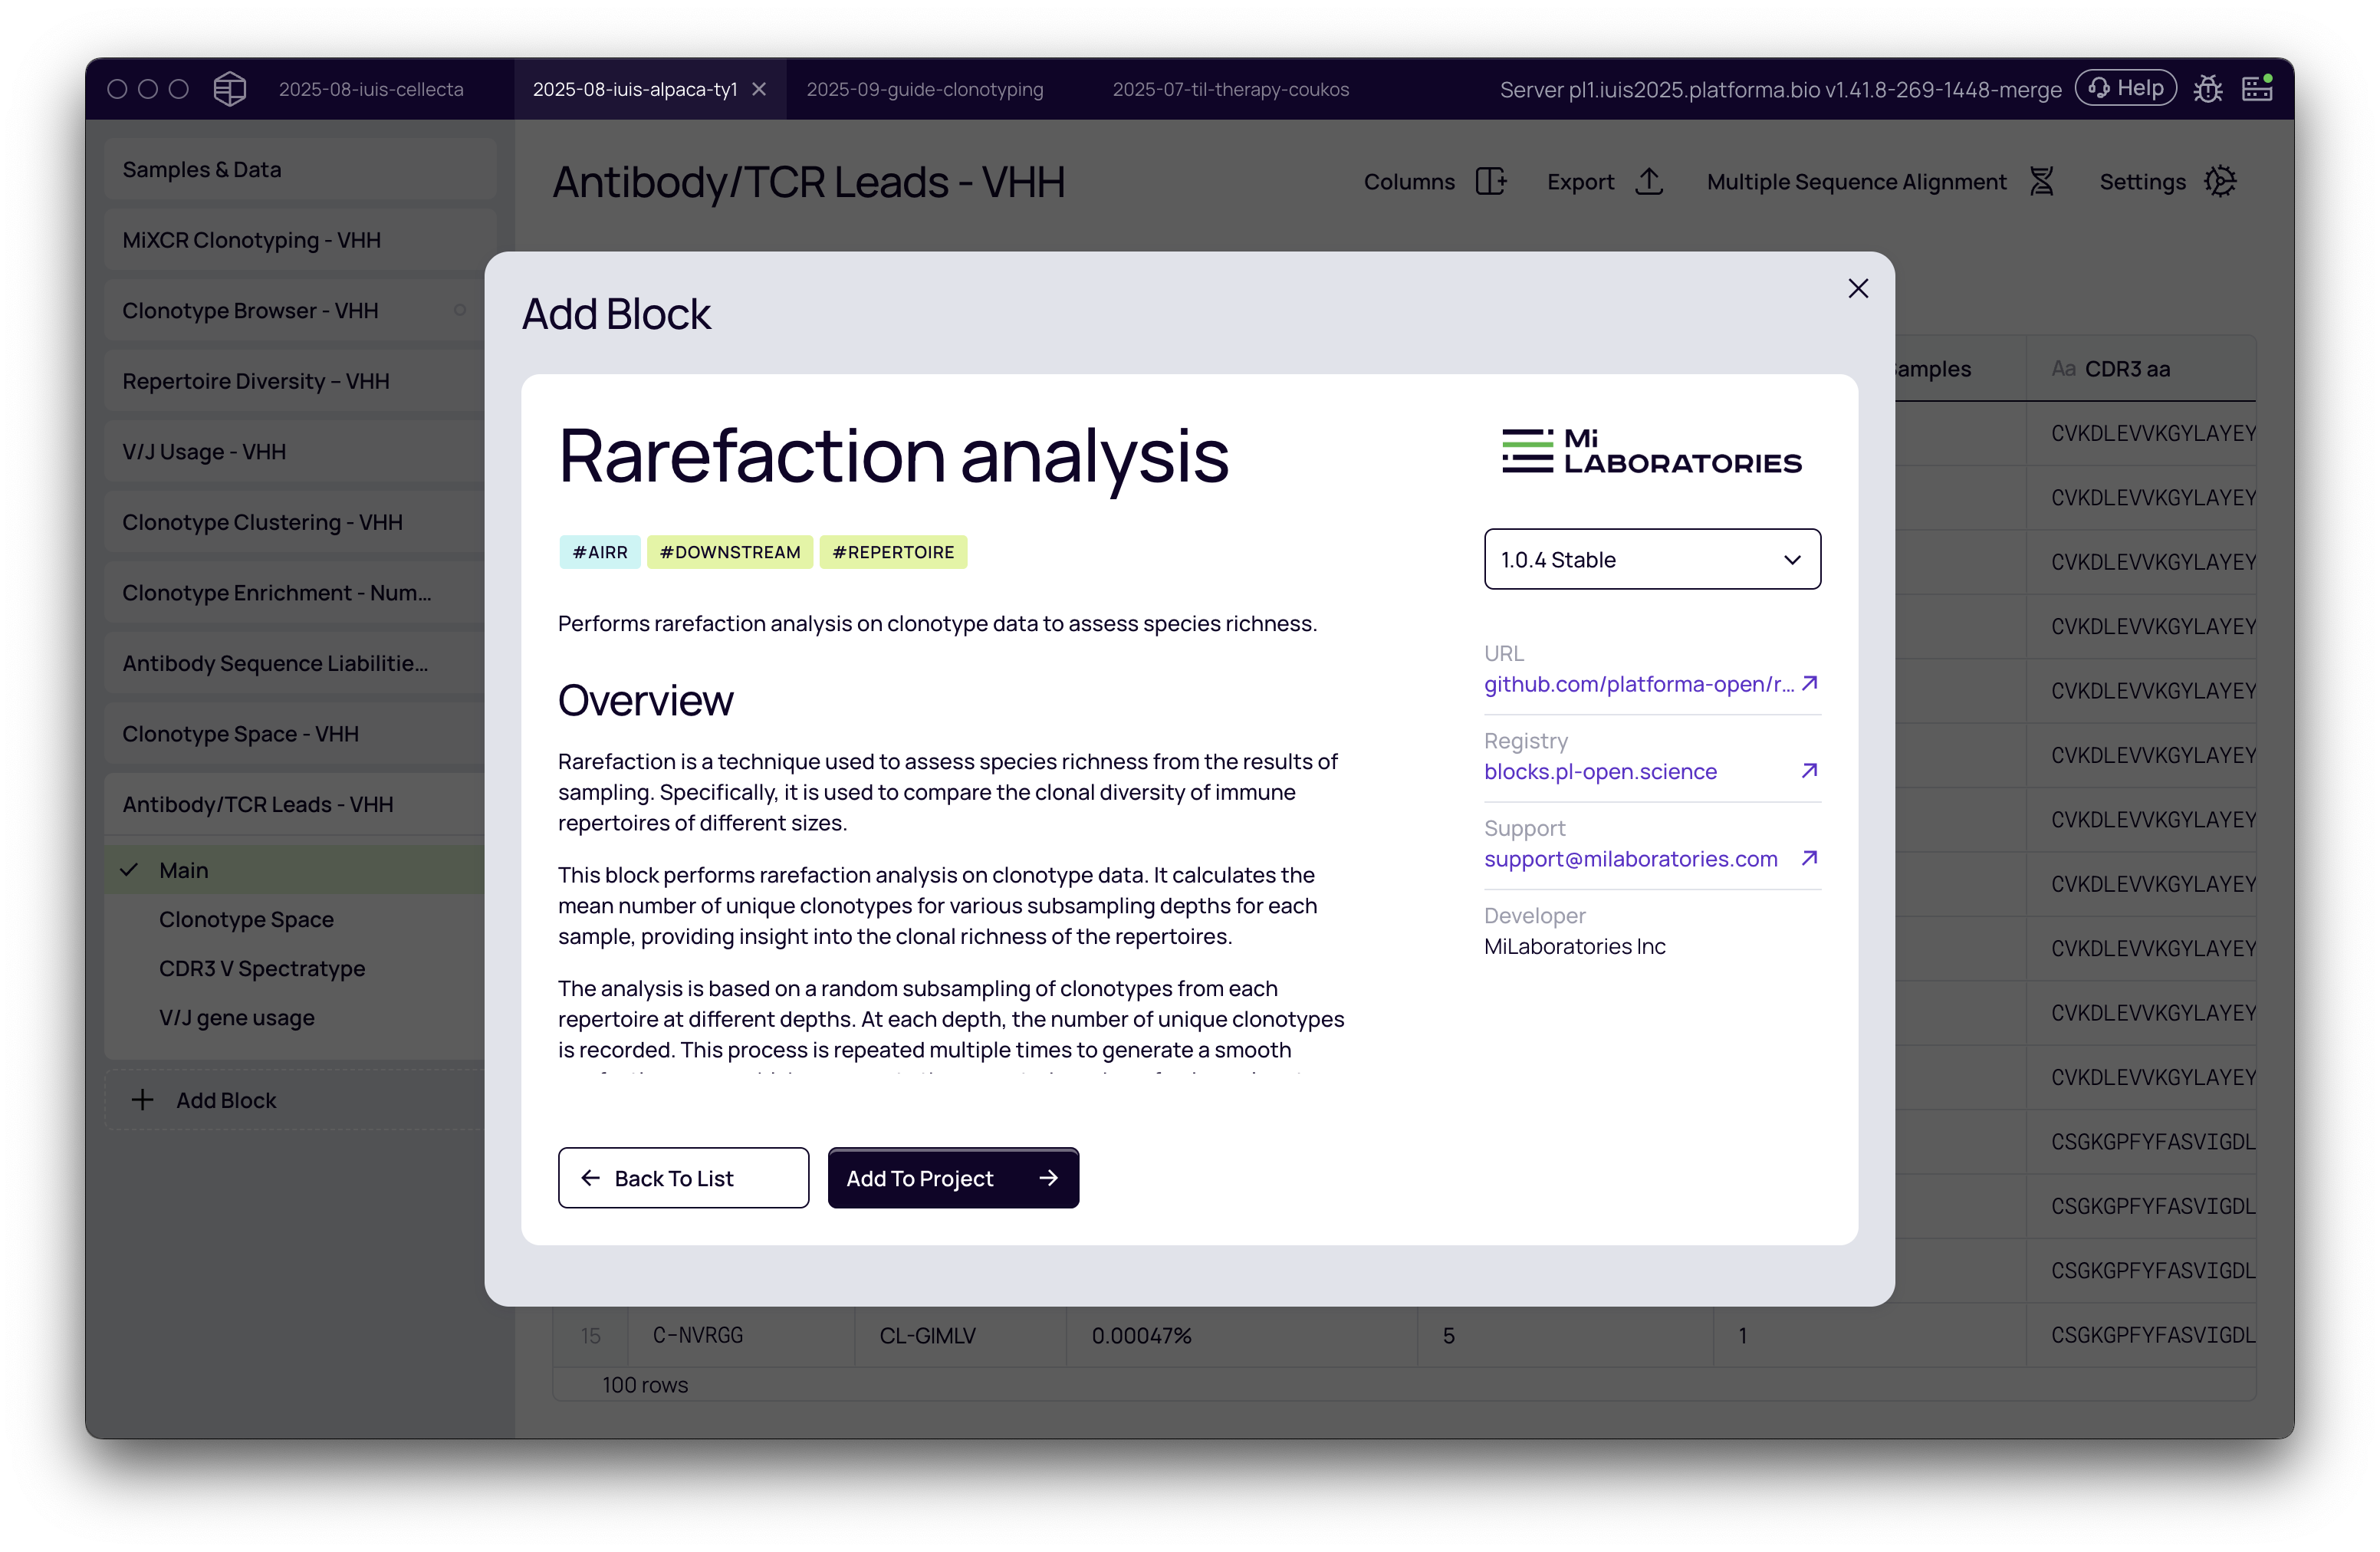
Rarefaction analysis is a powerful statistical technique, borrowed from ecology, that corrects for this disparity. It allows for a fair, apples-to-apples comparison of clonal richness by calculating the expected number of unique clonotypes that would be observed at a given, standardized sequencing depth.
This analysis generates a rarefaction curve for each sample, which plots the number of unique clonotypes (y-axis) as a function of sequencing depth (x-axis). These curves help you answer two key questions:
- Was the sequencing depth sufficient to capture the majority of the diversity in a sample?
- How does the clonal richness compare between samples, once they are normalized to the same sequencing depth?
Project setup
Before beginning the rarefaction analysis, ensure you have successfully run the MiXCR Clonotyping block on your sequencing data or the Import V(D)J Data block if you are starting with pre-processed data. The Rarefaction Analysis block uses the clonotype tables generated by these upstream blocks as its input.
Performing rarefaction analysis
Follow these steps to run the rarefaction analysis on your immune repertoire data.
Adding the Rarefaction Analysis block
- From your project's analysis pipeline, click the Add Block button.
- A dialog box will appear. Use the search bar to find and select the Rarefaction Analysis block.
- Click Add to Project to add it to your analysis pipeline.
Configuring the analysis
Once the block is added, configure the analysis settings in the right-hand panel.
- Select dataset: Choose the clonotyping results you wish to analyze from the dropdown menu (e.g., IG Heavy).
- Input points number: This determines the number of subsampling depths to calculate along the curve. A higher number creates a smoother curve but may increase computation time. The default setting is suitable for most use cases.
- Number of iterations per depth: This sets the number of times to repeat the random subsampling at each depth point to generate a stable average. More iterations yield a more precise curve but require more computation.
- Extrapolate to largest sample: If checked, the analysis will use the Chao1 estimator to predict the number of unique clonotypes beyond the actual sequencing depth of smaller samples, up to the depth of the largest sample. This allows for a more direct comparison across the full range of sequencing depths in your project.
Once you have configured the settings, click the Run button.
Interpreting the rarefaction curves
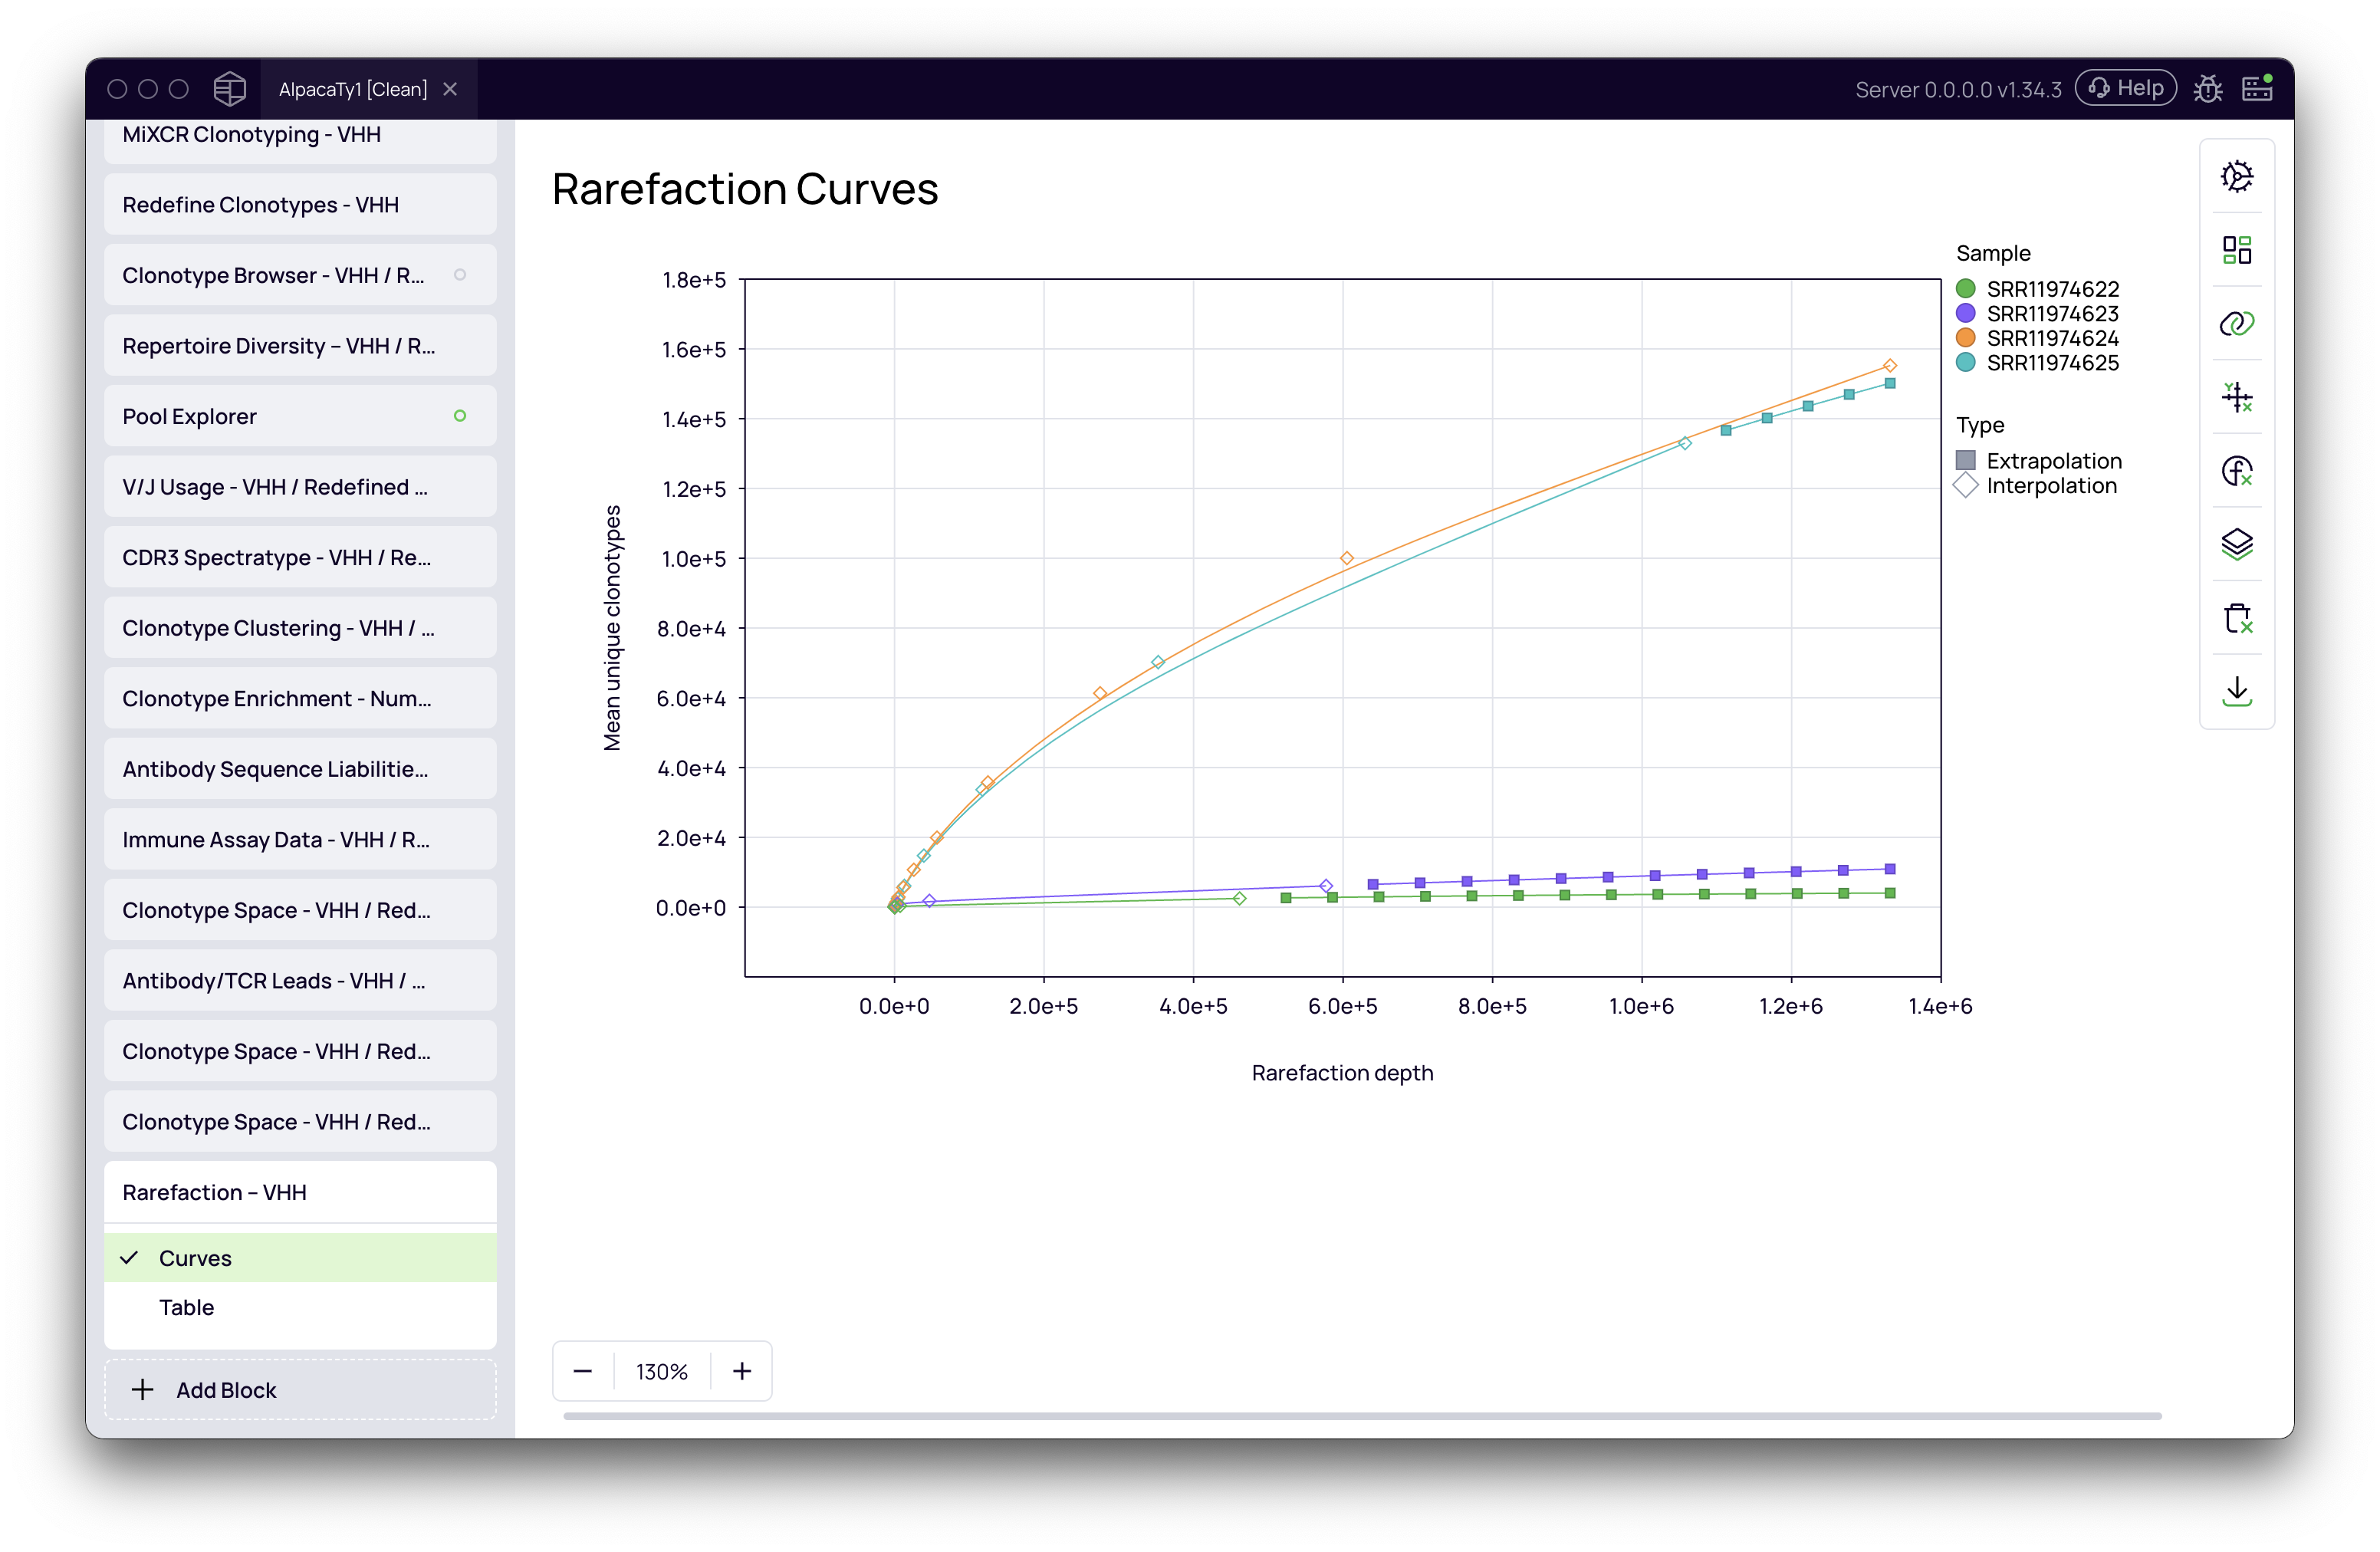
The primary output is the Rarefaction Curves plot, which visualizes the clonal diversity for each sample, allowing for direct comparison.
Assessing sequencing depth
The shape of an individual curve provides critical information about whether your sequencing run was deep enough to capture the sample's full diversity.
- Plateauing Curve: If a curve flattens and approaches a horizontal asymptote, it indicates that most of the sample's clonal diversity has been captured. Further sequencing would likely only re-sequence existing clonotypes. This suggests that the sequencing depth was sufficient. In the video example, the post-enrichment phage display samples show this behavior.
- Steeply Rising Curve: If a curve is still rising steeply at its end, it means that new, unique clonotypes were still being discovered at a high rate when sequencing stopped. This indicates that the sample was undersampled, and the full diversity has not been captured. In the video, the initial, pre-enrichment libraries demonstrate this pattern.
Comparing clonal richness between samples
To compare richness, examine the relative positions of the curves. At any given sequencing depth (any point on the x-axis), a curve that is higher up on the plot corresponds to a sample with a higher number of unique clonotypes. Rarefaction thus allows you to conclude that this sample has a greater clonal richness.
Understanding interpolation vs. extrapolation
The curve for each sample may consist of two parts, often distinguished by solid vs. dashed lines or different point shapes:
- Interpolation: This portion of the curve (solid line) is calculated by subsampling the actual, existing data in your sample. It represents the measured diversity within the sequenced reads.
- Extrapolation: This portion (dashed line, if enabled) is a statistical estimation of diversity beyond your sequencing depth. It helps predict how the curve might behave with deeper sequencing and is useful for visualizing all samples on a comparable scale.
Practical scenarios and recommendations
| Your Goal... | What to Look For... | Interpretation |
|---|---|---|
| Assess if sequencing was deep enough for a sample | The shape of that sample's curve. | A plateauing curve means sequencing was sufficient. A steeply rising curve means the sample was undersampled. |
| Compare clonal richness between samples | The relative vertical position of the curves. | At any given point on the x-axis, the higher curve belongs to the sample with greater clonal richness. |
| Decide if you need to re-sequence your samples | Steeply rising curves for your key samples. | If the curves for important samples don't plateau, it is a strong indicator that deeper sequencing would provide a more complete picture. |
| Find the most diverse sample in a cohort | The curve that is consistently highest across the plot. | This sample is estimated to have the highest clonal richness, normalized for sequencing depth. |