Diversity and Clonality
The immune repertoire represents the complete collection of T-cell receptors (TCRs) and B-cell receptors (BCRs) in an individual. The diversity of this repertoire is a critical indicator of the immune system's health and its capacity to respond to a wide array of antigens. A diverse repertoire is generally associated with a robust immune system, while reduced diversity can indicate an ongoing immune response, immunodeficiency, or certain diseases.
Clonality is the inverse concept to diversity. A highly clonal repertoire is dominated by a few expanded clonotypes, often in response to a specific antigen, such as during an infection or in cancer. Therefore, analyzing both diversity and clonality provides crucial insights into the state of the immune system.
This guide will walk you through the steps to calculate and visualize diversity metrics using Repertoire Diversity block.
Project setup
Before beginning the diversity analysis, ensure you have successfully run the MiXCR Clonotyping block on your sequencing data or Import V(D)J Data block if you are starting with already pre-processed data). The Repertoire Diversity block uses the clonotype tables generated by upstream blocks as its input.
For the illustrations below, we'll use a project that has already been processed with MiXCR Clonotyping.
Performing diversity analysis
Adding the Repertoire Diversity block
After processing your raw sequencing data with the MiXCR Clonotyping block, you will have a set of clonotypes ready for downstream analysis.
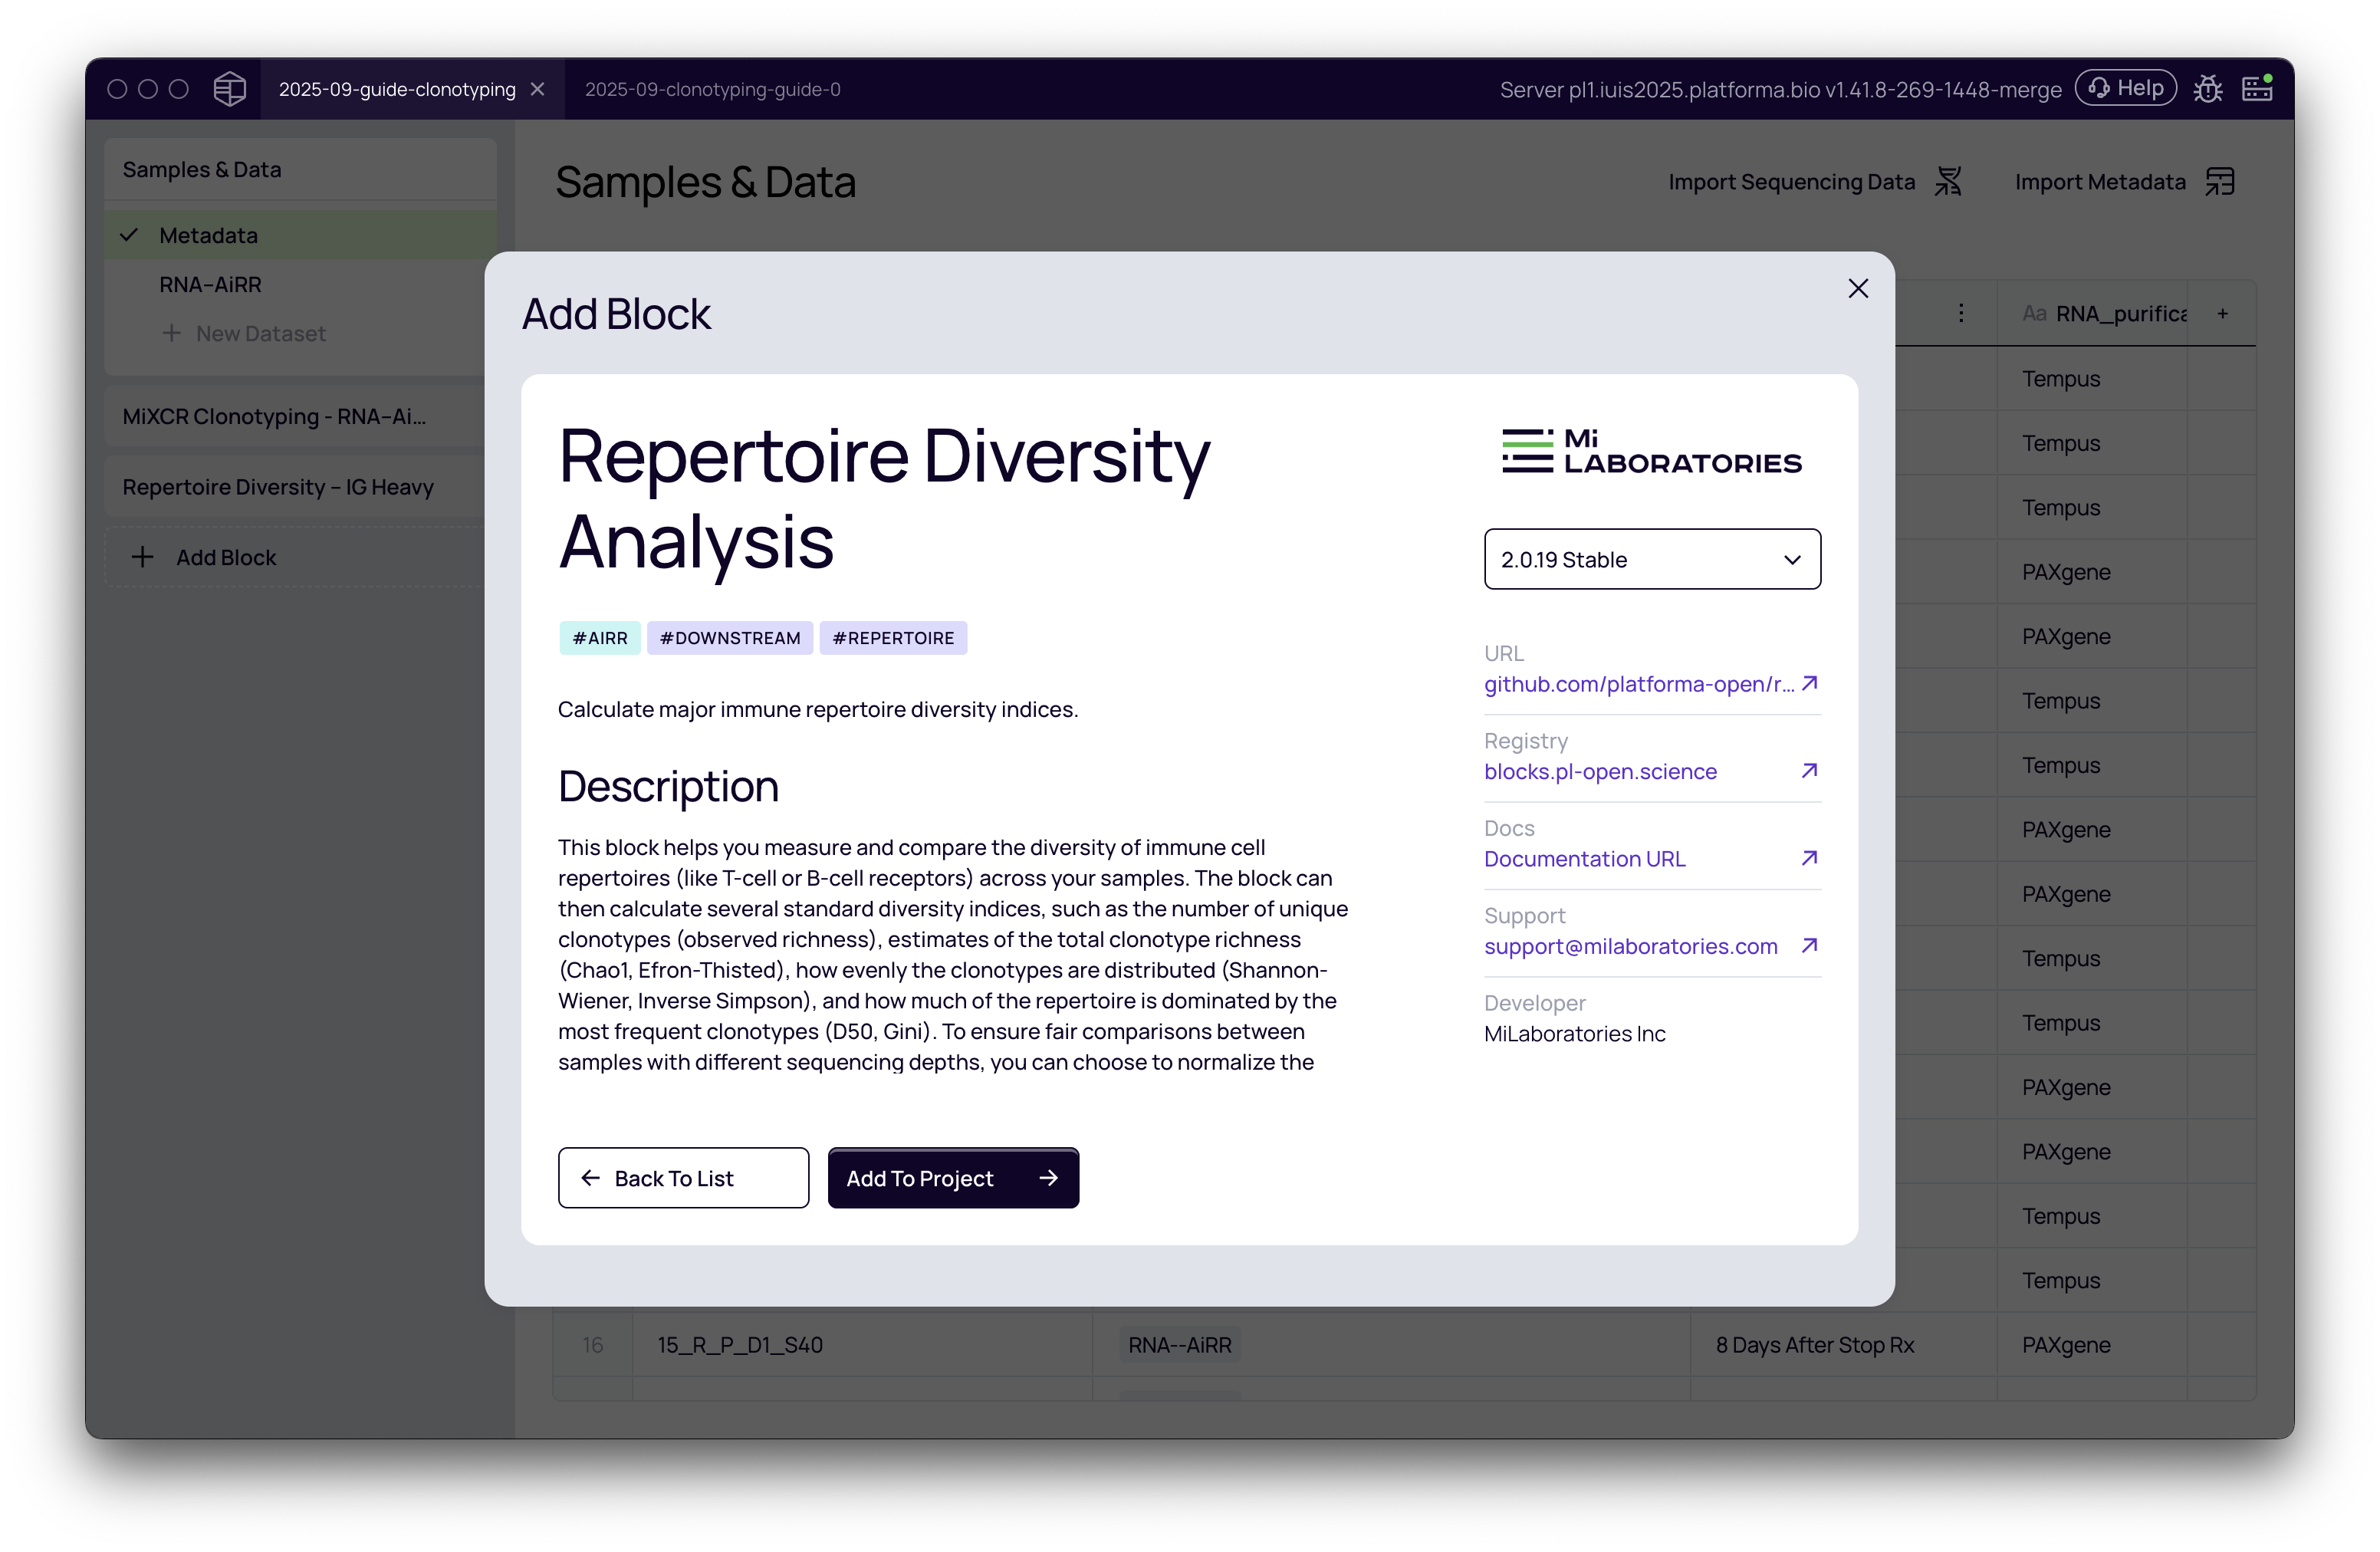
- From your project pipeline, click the Add Block button.
- Use the search bar to find and select the Repertoire Diversity analysis block.
- Click Add to Project to add it to your analysis pipeline.
Configuring the analysis
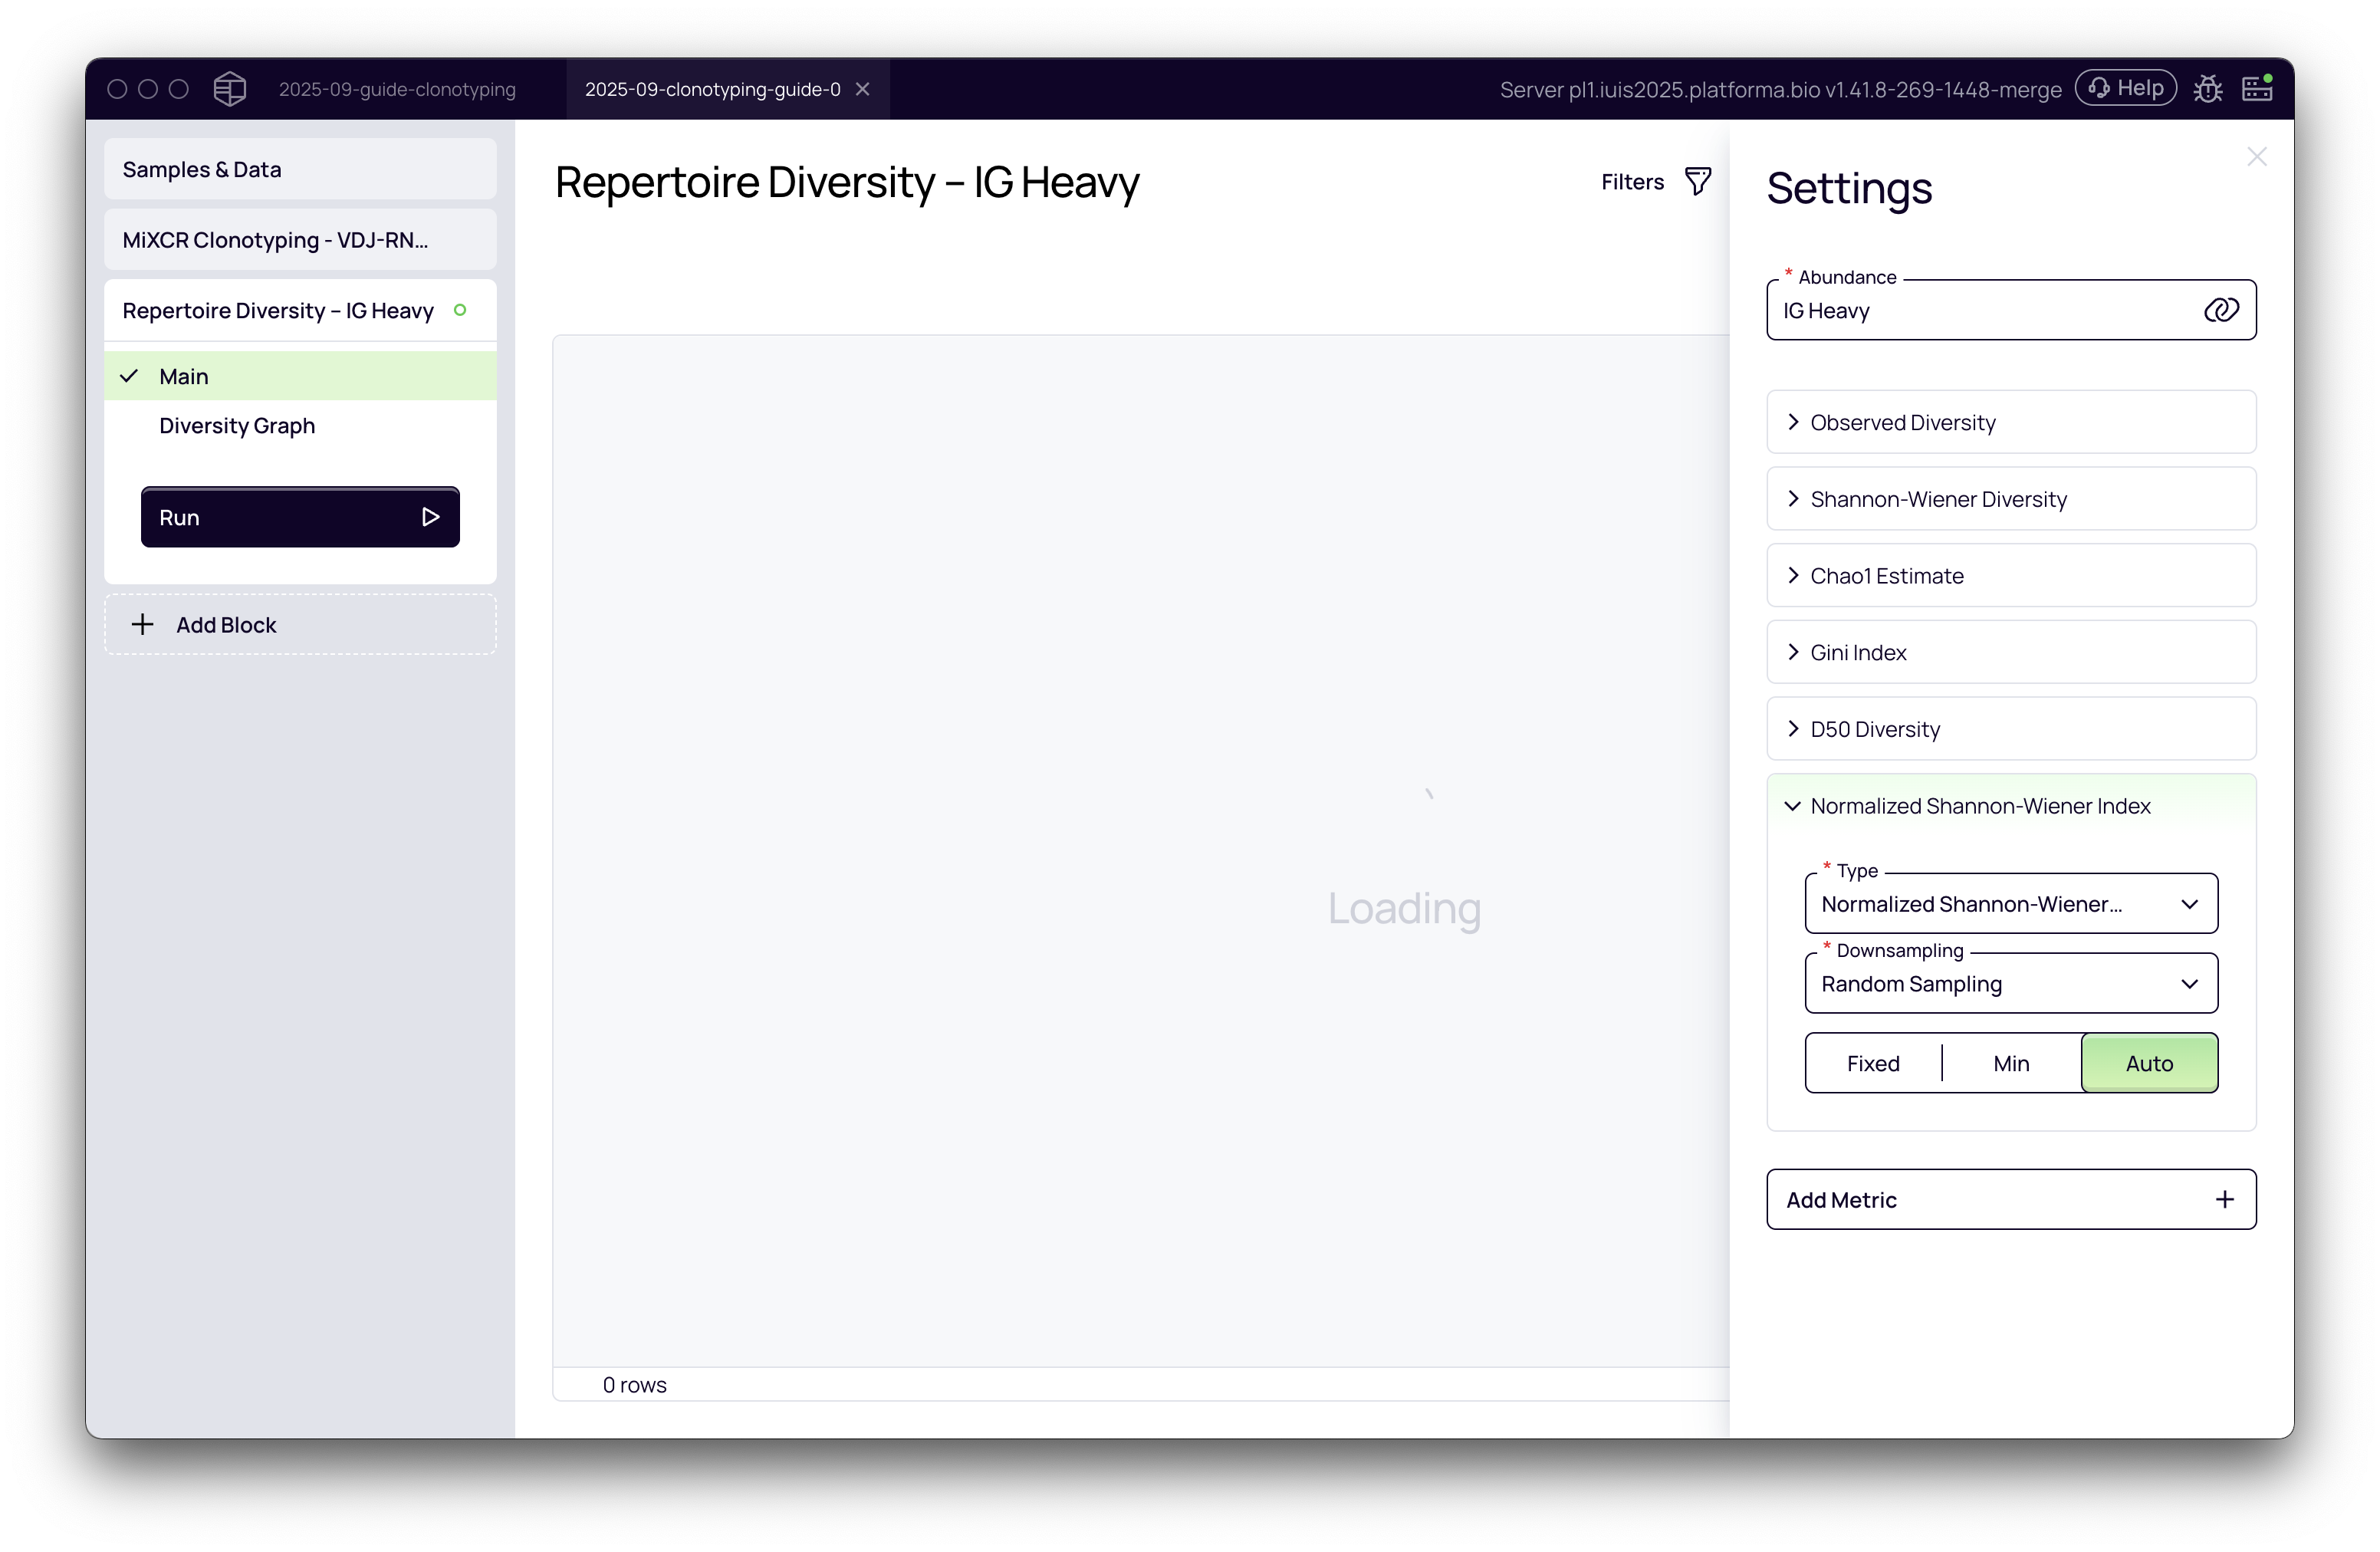
Once the block is added, you need to configure the settings for the analysis.
Select the abundance metric: The first step is to choose the basis for your diversity calculation. This is typically the abundance of specific immune receptor chains. In the Settings panel on the right, you will see a dropdown menu for the abundance metric. The options available correspond to the chains you selected for analysis in the upstream MiXCR Clonotyping block. For bulk sequencing data, you must analyze one chain at a time. For this example, we'll select IG Heavy.
The primary abundance metric used (e.g., UMI counts or read counts) is automatically inherited from the settings of the preceding MiXCR Clonotyping block, based on the kit/preset used.
Choose diversity metrics: Platforma pre-selects a set of common and informative diversity metrics by default. You can add or remove metrics based on your research questions by clicking the Add Metric button.
Configure downsampling (normalization): Comparing diversity across samples with different sequencing depths can be misleading. A sample with more reads is likely to show more unique clonotypes by chance. To address this, Platforma uses downsampling to normalize the data. See the detailed guide below for choosing the best strategy.
Once you have configured the settings, click the Run button.
A deep dive into downsampling
Imagine you have two buckets of jellybeans, one small and one large. If you count the number of unique colors in each, the larger bucket will almost certainly have more, just because it contains more jellybeans. Comparing them directly wouldn't be fair. Downsampling is like taking the same-sized scoop from each bucket before counting the colors. This ensures you're making a fair comparison.
Platforma provides several methods to handle this. For each metric, you can select a downsampling strategy.
-
Random Sampling: This is the most scientifically robust method for comparing diversity between samples. A specified number of molecules (UMIs) or reads are randomly selected from each sample, and the diversity metrics are calculated on this subsampled dataset. This ensures that comparisons are made on an equal footing.
- Auto: Automatically selects the largest possible downsampling depth that still includes all samples. This is the recommended default for most analyses.
- Min: Downsamples all samples to the size of the smallest sample. This is a conservative approach that ensures no sample is excluded.
- Fixed: Allows you to set a specific number of molecules/reads for downsampling. This is useful if you want to reproduce an analysis or use a specific threshold based on prior knowledge.
-
Top N / Cumulative Top: These are not true normalization methods for diversity but rather filtering tools to focus on the most abundant clonotypes.
- Top N: Includes only the top N most abundant clonotypes in the calculation.
- Cumulative Top: Includes the most abundant clonotypes that cumulatively account for N% of the total repertoire.
- These methods can be useful for certain clonality analyses but should be used with caution when assessing overall diversity, as they discard information about rare clonotypes.
-
None: Skips downsampling. This is only appropriate if you are analyzing a single sample or if all your samples have a very similar sequencing depth.
Choosing the right diversity and clonality metrics
Different metrics tell different stories about your repertoire. Choosing the right one depends on the biological question you are asking.
Richness metrics: how many different clonotypes are there?
These metrics focus on the total number of unique clonotypes.
-
Observed Diversity:
- Question it answers: "How many unique clonotypes did I see in this sample?"
- What it is: The raw count of unique clonotypes.
- When to use it: Good for a simple, first-pass assessment of richness.
- Caution: Highly sensitive to sequencing depth. Always use it with Random Sampling downsampling for fair comparison.
- Read more about species richness
-
Chao1 Estimate:
- Question it answers: "How many unique clonotypes do I estimate are in the entire population, including those I didn't sequence?"
- What it is: An ecological metric that estimates the true richness of a sample by correcting for undersampling. It gives more weight to rare clonotypes (singletons and doubletons).
- When to use it: When you believe your sequencing did not capture the full diversity of the repertoire and you want a more accurate estimate of its true richness. Excellent for comparing richness across samples.
- Read more about Chao1 and richness estimates
Richness and evenness metrics: how are clonotypes distributed?
These metrics consider both the number of clonotypes (richness) and their relative abundances (evenness). A repertoire where all clonotypes have similar abundance is more diverse than one dominated by a few large clones.
-
Shannon-Wiener Diversity:
- Question it answers: "How much uncertainty/surprise is there in identifying a random clonotype?"
- What it is: An entropy index from information theory. A higher value means greater diversity—you are more "surprised" when picking a clonotype at random because there are many of them and they are more evenly distributed.
- When to use it: A robust, all-around metric that is good for most general diversity comparisons. It is less sensitive to sequencing depth than Observed Diversity but should still be used with downsampling.
- Read more about the Shannon-Wiener Index
-
Normalized Shannon-Wiener Index:
- Question it answers: Same as above, but on a normalized 0-1 scale.
- What it is: A normalized version of the Shannon-Wiener index, making it easier to compare across different studies or samples.
- When to use it: When you need a diversity score that is comparable across experiments.
Clonality and dominance metrics: who are the big players?
These metrics focus on the opposite of diversity: clonality. They measure how much the repertoire is dominated by a few highly expanded clonotypes.
-
Gini Index:
- Question it answers: "How unequal is the distribution of clonotype sizes?"
- What it is: A measure of inequality. A value of 0 means perfect evenness (all clonotypes have the same size). A value approaching 1 means maximum inequality (one clonotype makes up almost the entire repertoire).
- When to use it: Excellent for assessing clonality. Use this when you want to quantify the dominance of a few clones, for example, when tracking an antigen-specific response after vaccination or during cancer immunotherapy.
- Read more about the Gini Index
-
D50 Diversity:
- Question it answers: "What percentage of unique clonotypes makes up the most abundant 50% of the repertoire?"
- What it is: The percentage of the top clones that account for 50% of the total reads/UMIs.
- When to use it: A very intuitive metric for clonality. A low D50 value means high clonality (e.g., "1% of clonotypes make up 50% of the repertoire"). A high D50 value means high diversity. It is particularly useful for visualizing the "peakiness" of the immune response.
- Read more about D50 in the context of immune repertoires
Practical scenarios and recommendations
| Your Goal... | Recommended Downsampling | Recommended Metrics | Why? |
|---|---|---|---|
| Compare overall diversity between patient groups (e.g., treated vs. control) | Random Sampling (Auto or Min) | Shannon-Wiener, Chao1 | These metrics give a robust assessment of richness and evenness. Downsampling is essential for a fair comparison. |
| Track clonal expansion over time (e.g., after vaccination or therapy) | Random Sampling (Auto or Min) | Gini Index, D50 | These metrics are specifically designed to measure dominance and inequality, which is exactly what happens during a targeted immune response. |
| Assess if you sequenced deep enough to capture most of the diversity | None (run on a single sample) | Observed Diversity, Chao1 | Compare the raw number of observed clonotypes to the Chao1 estimate. If Chao1 is much higher, it suggests your sequencing was not deep enough to capture the full repertoire. |
| Identify highly clonal samples within a large cohort | Random Sampling (Auto or Min) | Gini Index, D50 | Sort your samples by Gini Index (high to low) or D50 (low to high) to quickly find the ones with the most dominant clones. |
Interpreting the results
Results table
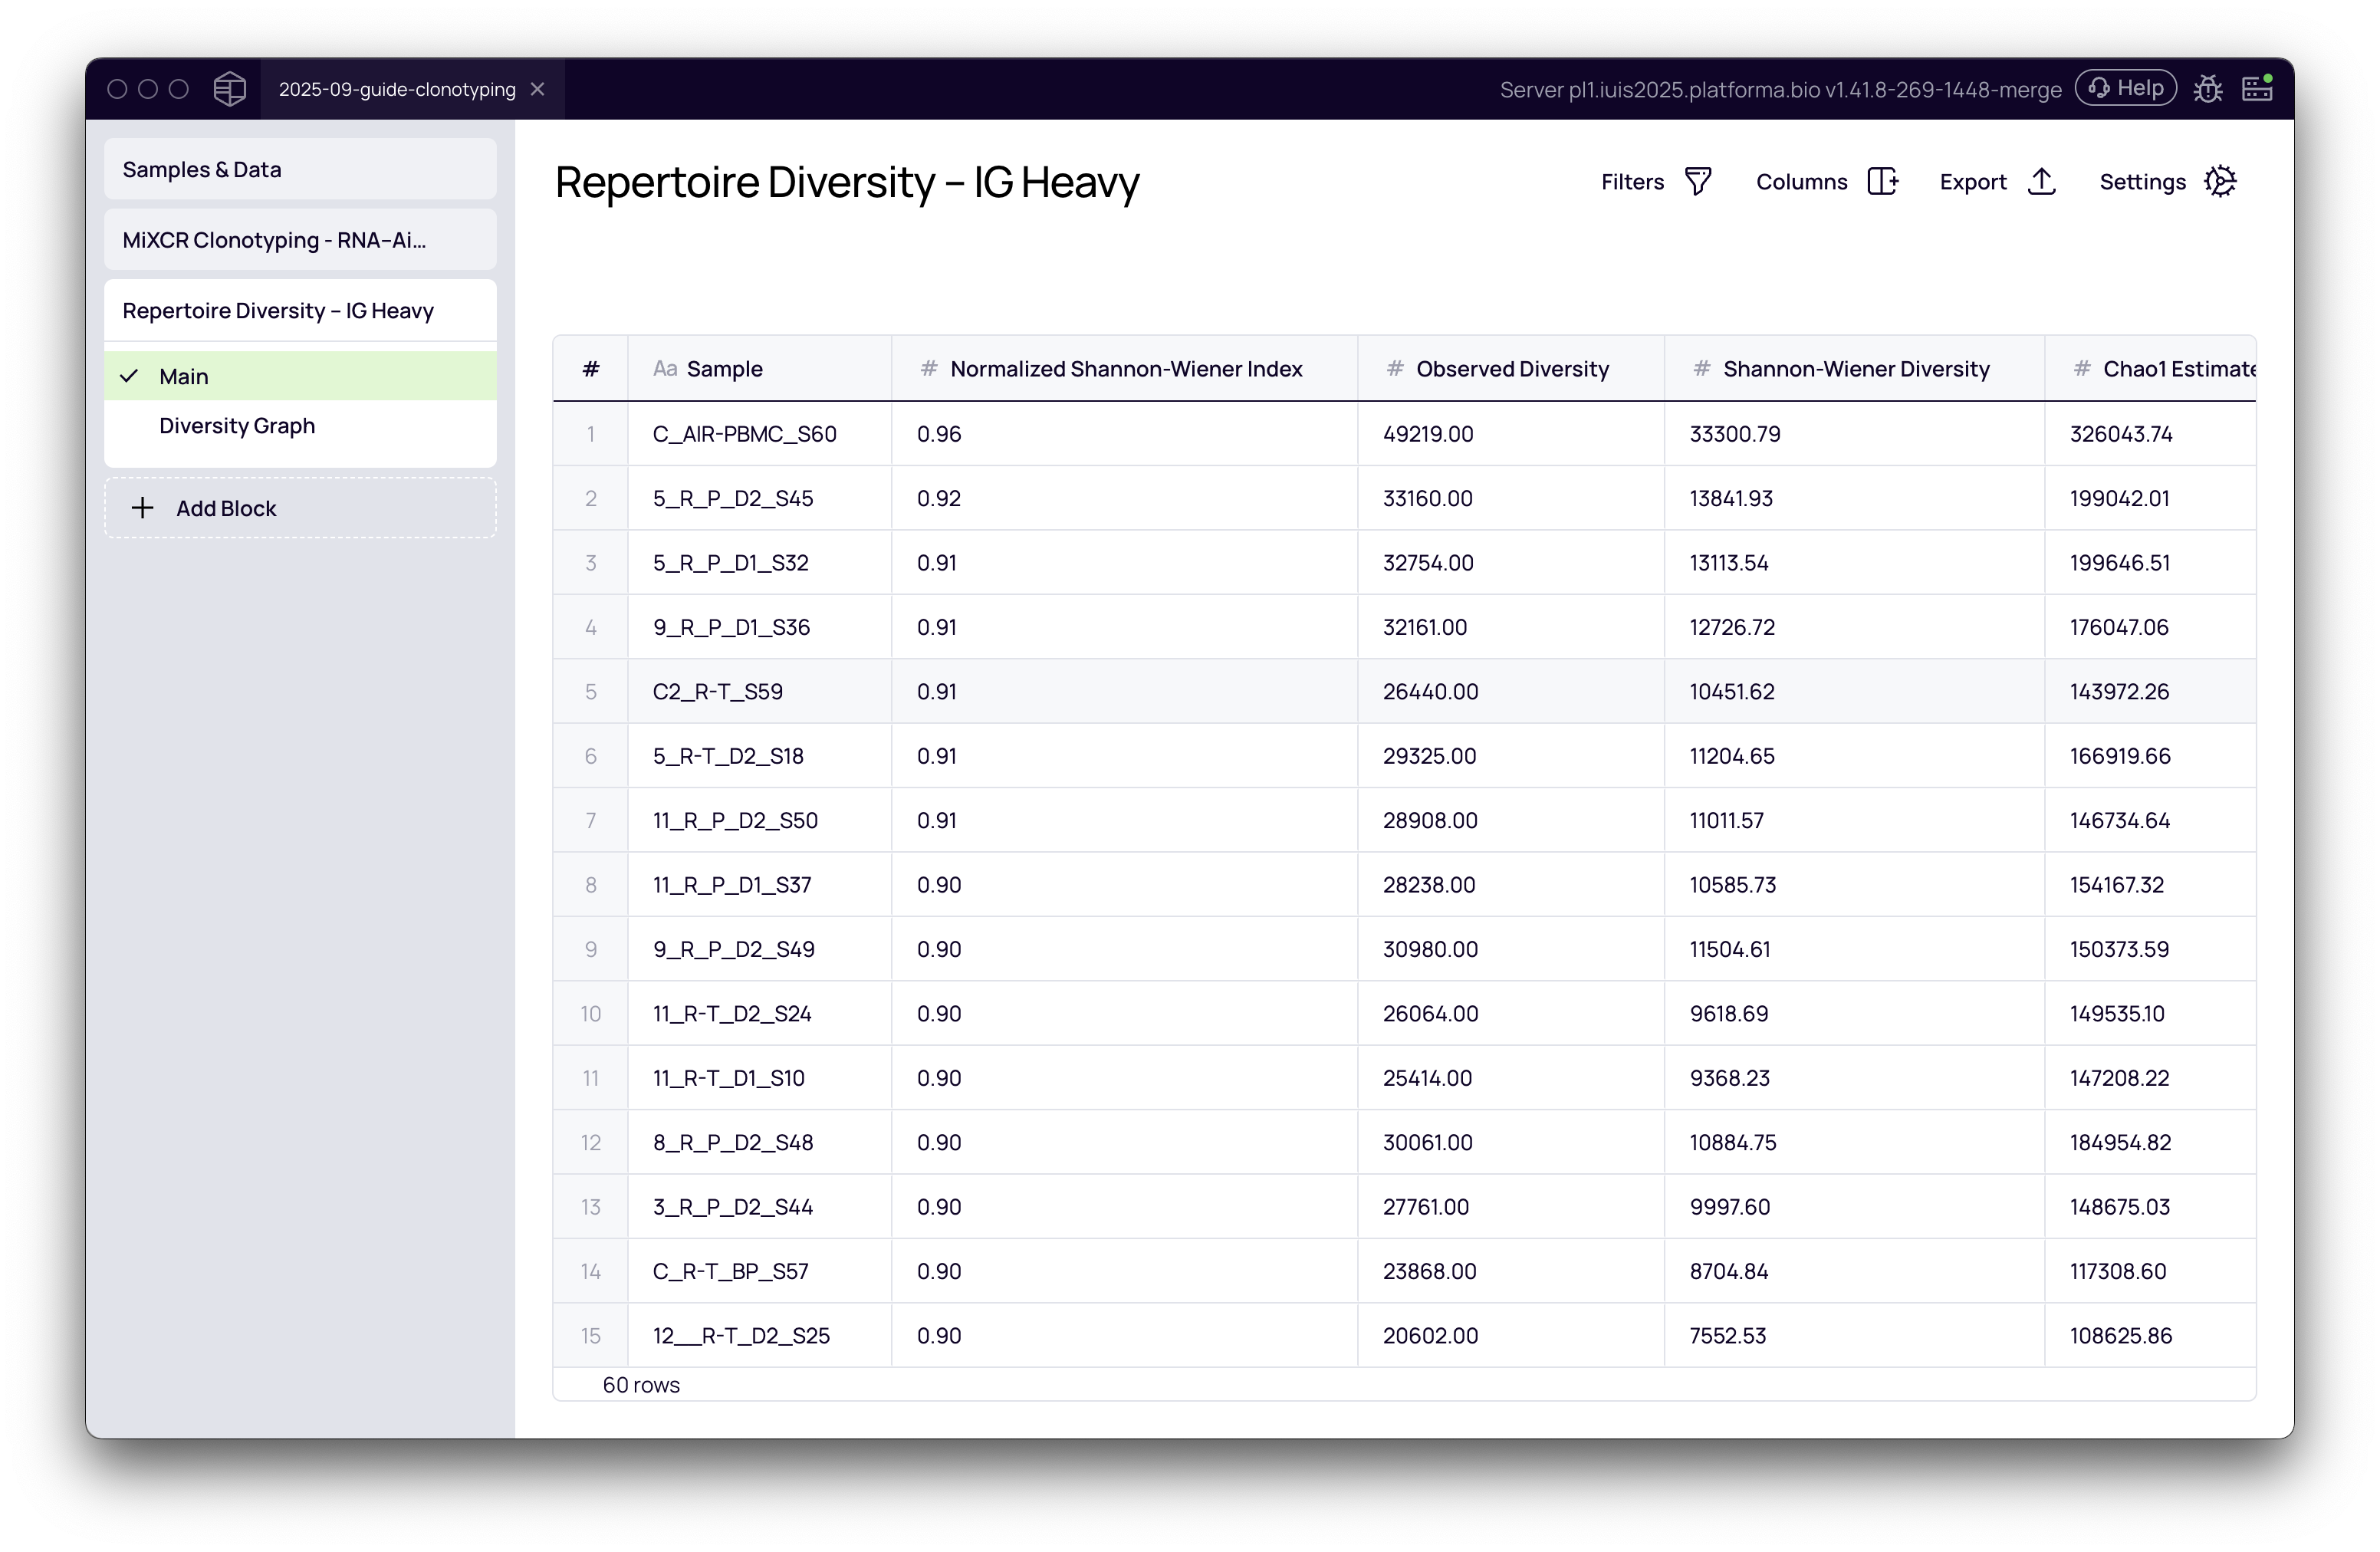
After the analysis is complete, the block will generate a table displaying the calculated diversity values for each metric across all your samples. This table provides a quantitative overview and can be exported for further analysis.
Visualizing diversity with the Graph Maker
The most powerful way to interpret diversity is through visualization.
- Navigate to the Diversity Graph tab. This will open Platforma's versatile Graph Maker tool.
- Data Mapping:
- On the right-hand panel, select the diversity metric you want to plot on the Y-axis (e.g., Normalized Shannon-Wiener Index).
- For the Primary grouping (X-axis), you can use sample names, but it's more informative to use metadata. If you uploaded a metadata file, you can group your samples by experimental variables like
time_point,treatment_group, ordisease_status.
- Customizing the Plot:
- Plot Type: The Graph Maker offers various plot types. For time-course data, Line + Jittered Dots is excellent for visualizing trends. Boxplot or Violins are great for comparing groups.
- Ordering: If you are using a categorical variable like time points, ensure they are in the correct chronological order. Go to the Axes settings -> Primary group order and drag-and-drop the groups into the desired sequence.
- Statistics: Add statistical significance to your plot. In the Statistics tab, you can perform an Overall P-value calculation (e.g., Kruskal-Wallis test). You can also perform pairwise comparisons (e.g., Wilcoxon or T-test) against a reference group (e.g., 'Control Before Treatment') to see which specific groups are significantly different.
- Aesthetics: Customize titles, colors, and labels to create a publication-ready figure.
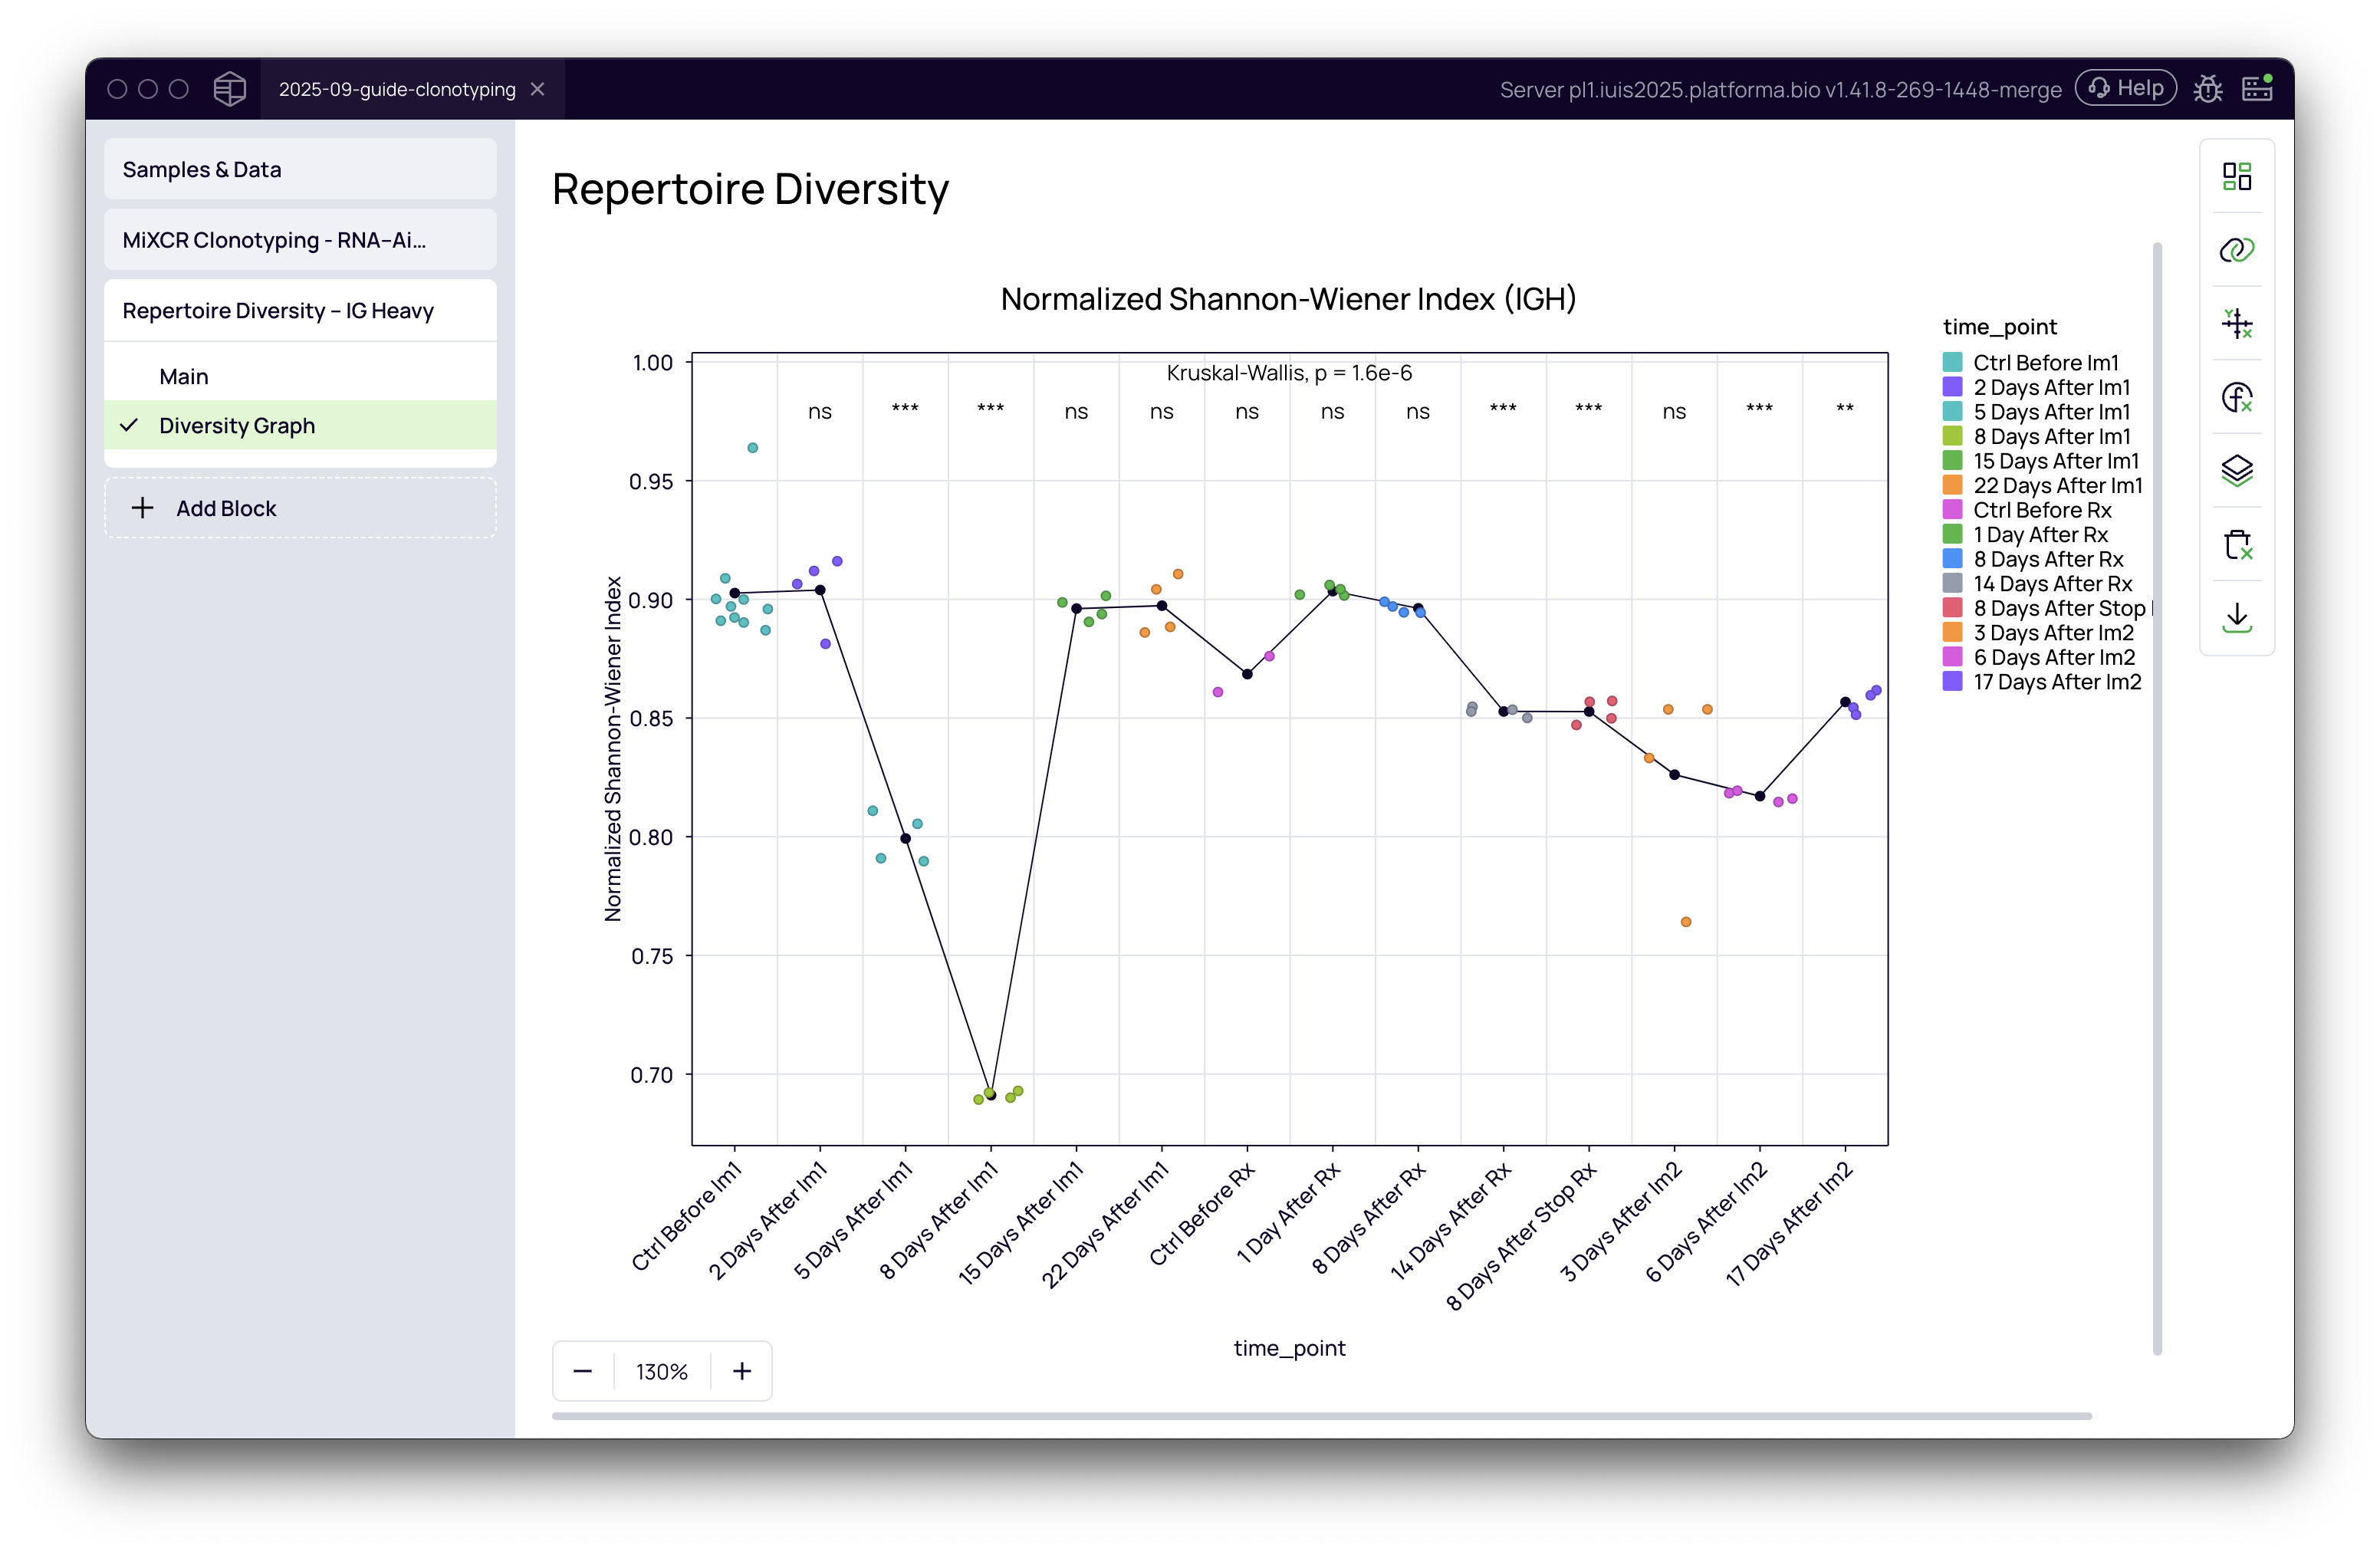
By leveraging the Repertoire Diversity block and the Graph Maker in Platforma, you can move from raw sequencing data to insightful, publication-quality visualizations of your immune repertoire dynamics.