TCR/BCR Clonotyping
Clonotyping is a key step in VDJ analysis, especially when starting from raw sequencing data. This guide explains how to perform clonotyping analysis with the MiXCR Clonotyping Block.
MiXCR is a gold-standard tool for TCR and BCR analysis, supporting a full spectrum of technologies:
- Next-generation (paired- and single-end) and Sanger sequencing data
- Bulk data with and without molecular barcodes
- Single cell data from both high-throughput (10x Genomics, ParseBio etc) and plate-based technologies
- Non targeted like bulk RNA-Seq or Exome-Seq
- Short and long-read (ONT, PacBio, etc.) sequencing
In this guide, we focus on profiling donor V(D)J libraries. For special cases, you can check:
For more detailed information on the MiXCR tool, see:
- Official documentation website
- MiXCR: software for comprehensive adaptive immunity profiling, Nature Methods 12, no. 5 (2015): 380-381
- Antigen receptor repertoire profiling from RNA-seq data, Nature Biotechnology 35, 908–911 (2017)
In this guide, we cover clonotyping analysis from raw sequencing data (FASTQ/FASTA files). If you already have preprocessed clonotype tables in TSV/CSV format, you don't need to run clonotyping analysis and can directly import this data with the Import V(D)J Data Block.
Project setup
Before beginning the clonotyping analysis, ensure your project is properly set up and you have added your raw sequencing datasets. See the Data Import Guide for details.
For the illustrations below, we'll use a project with bulk TCR and BCR sequencing data already imported, but the same steps apply to any other data type.
Adding the MiXCR Clonotyping block
Once your data is ready, the next step is to add the MiXCR Clonotyping block to your project.
- Click the "+ Add Block" button in the left-hand menu.
- From the "Add Block" modal, select "MiXCR Clonotyping". This block is designed to extract TCR and BCR clonotypes from next-generation sequencing data.
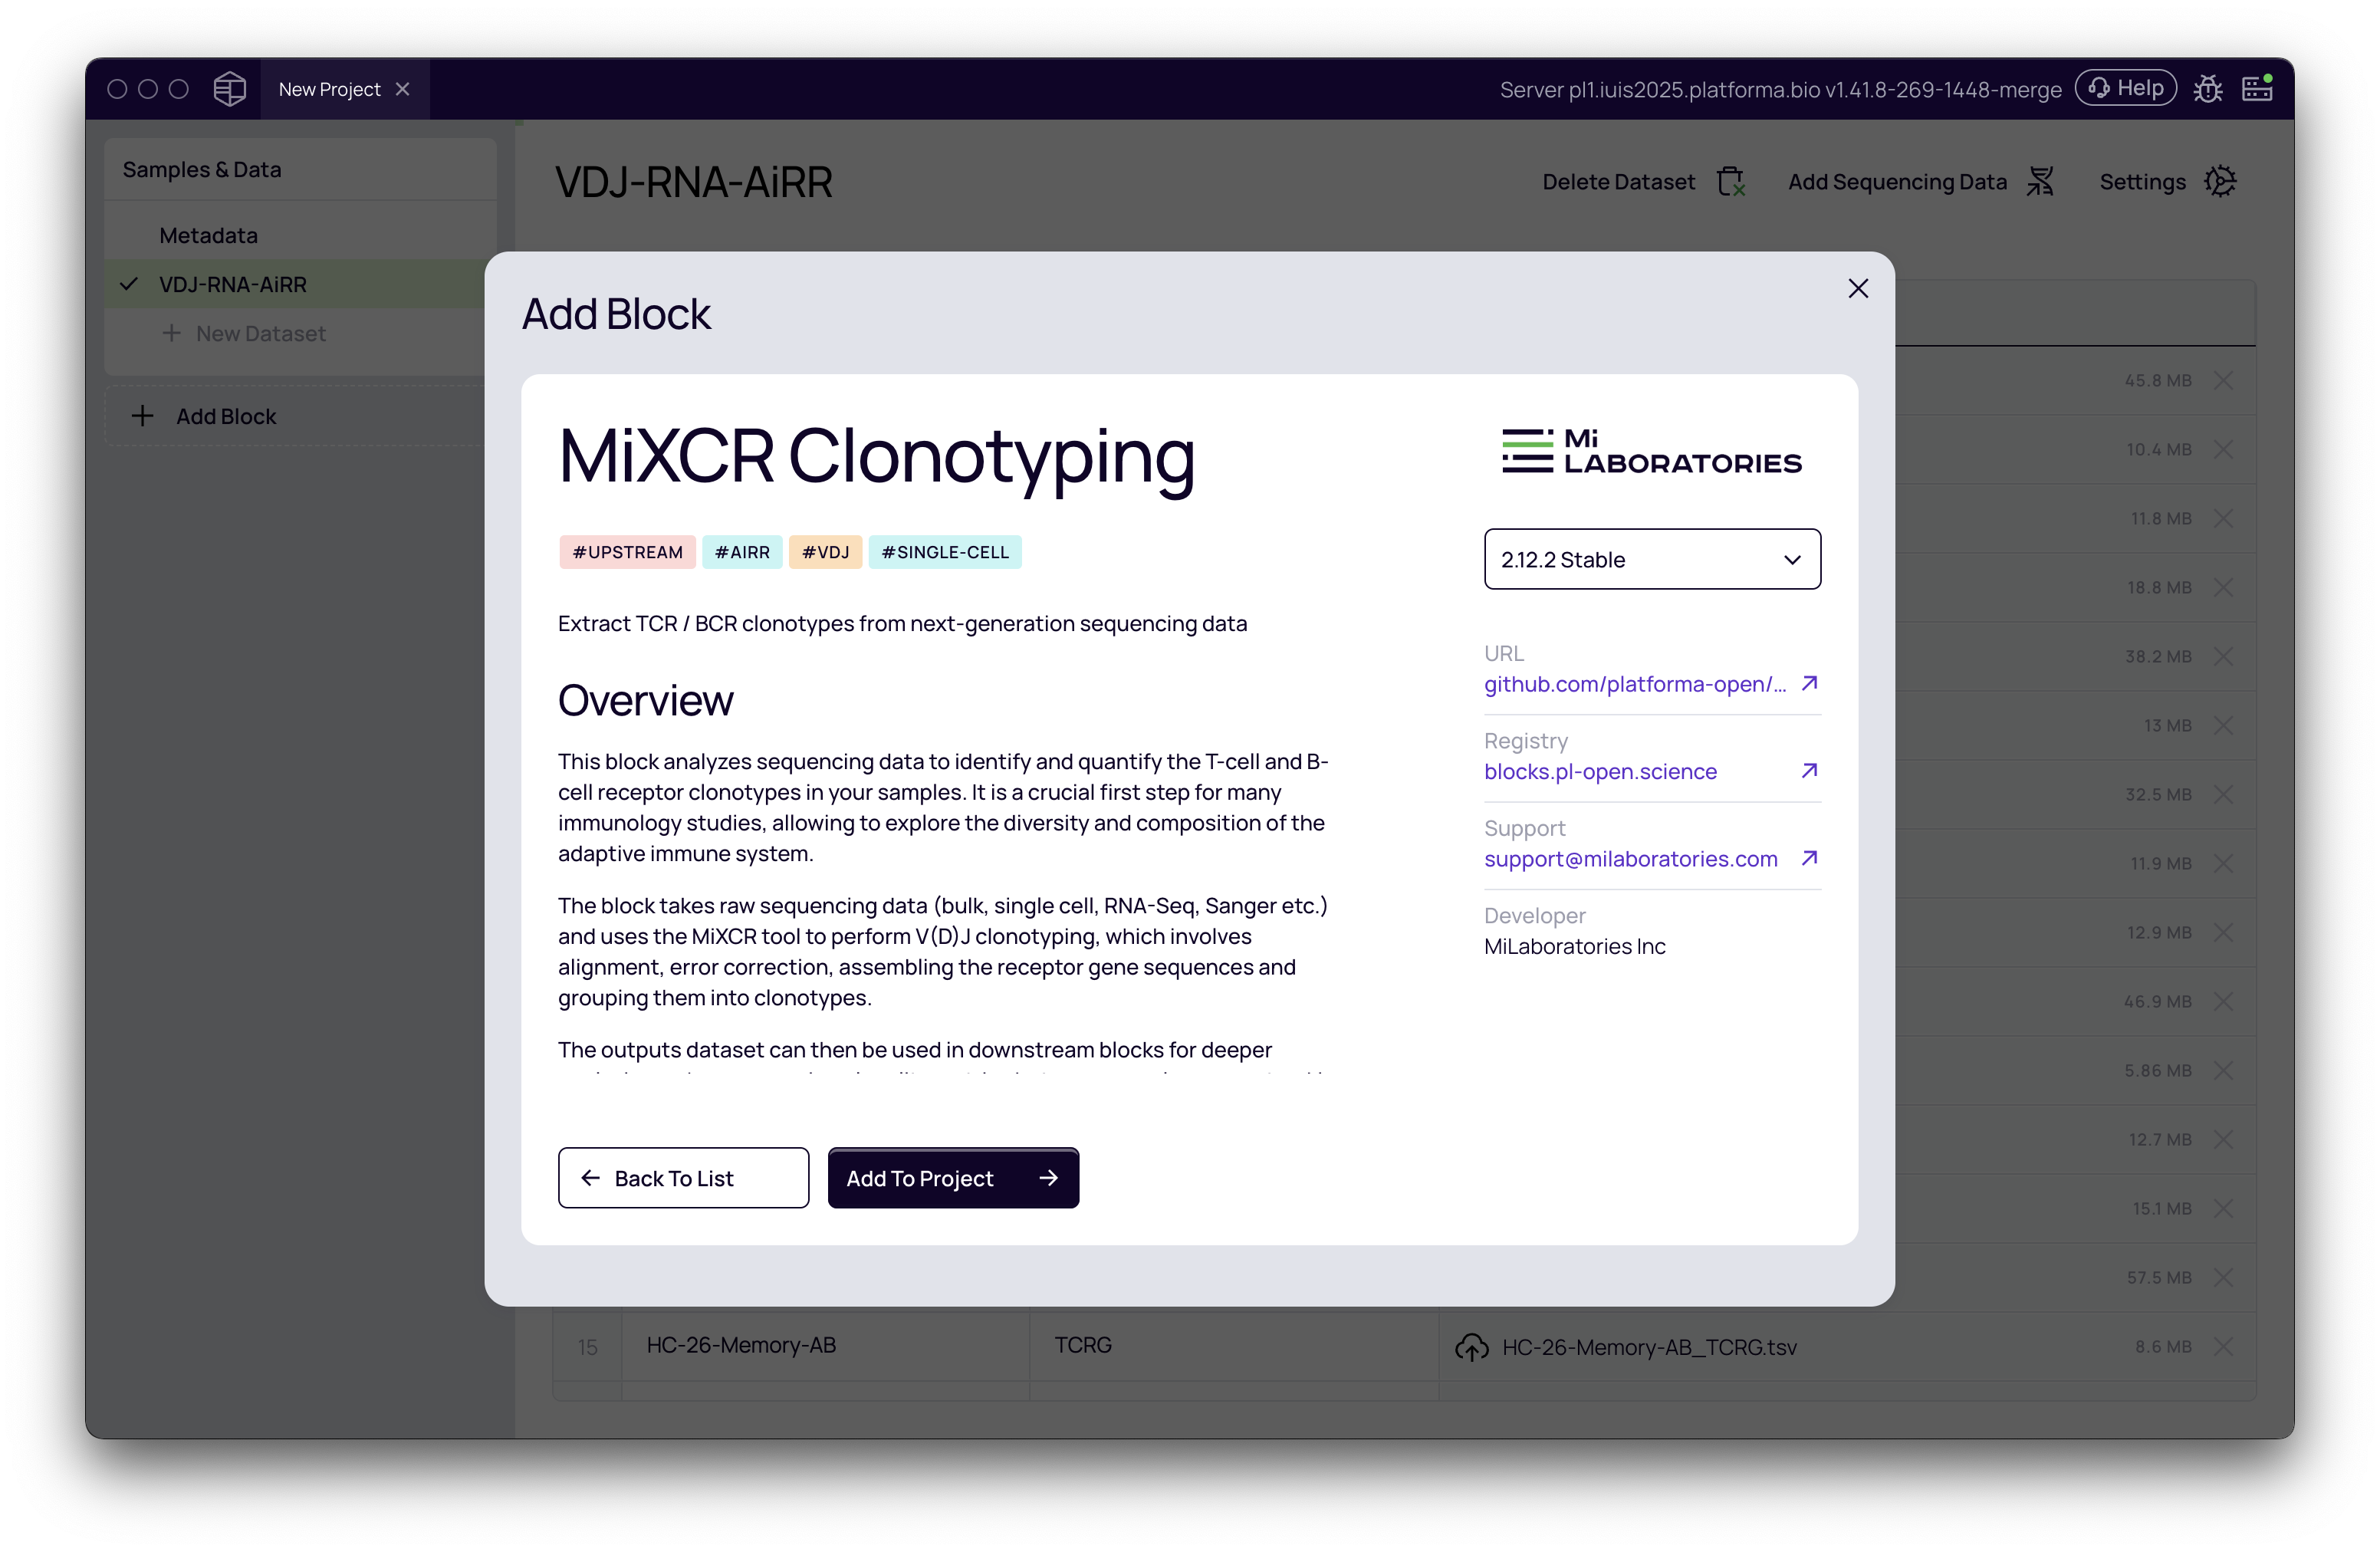
Other related blocks are available for more specific use cases, such as MiXCR Amplicon Alignment for artificial sequences or MiXCR scFv Clonotyping for single-chain variable fragments. For standard bulk or single-cell VDJ analysis, MiXCR Clonotyping is the correct choice.
Configuring clonotyping settings
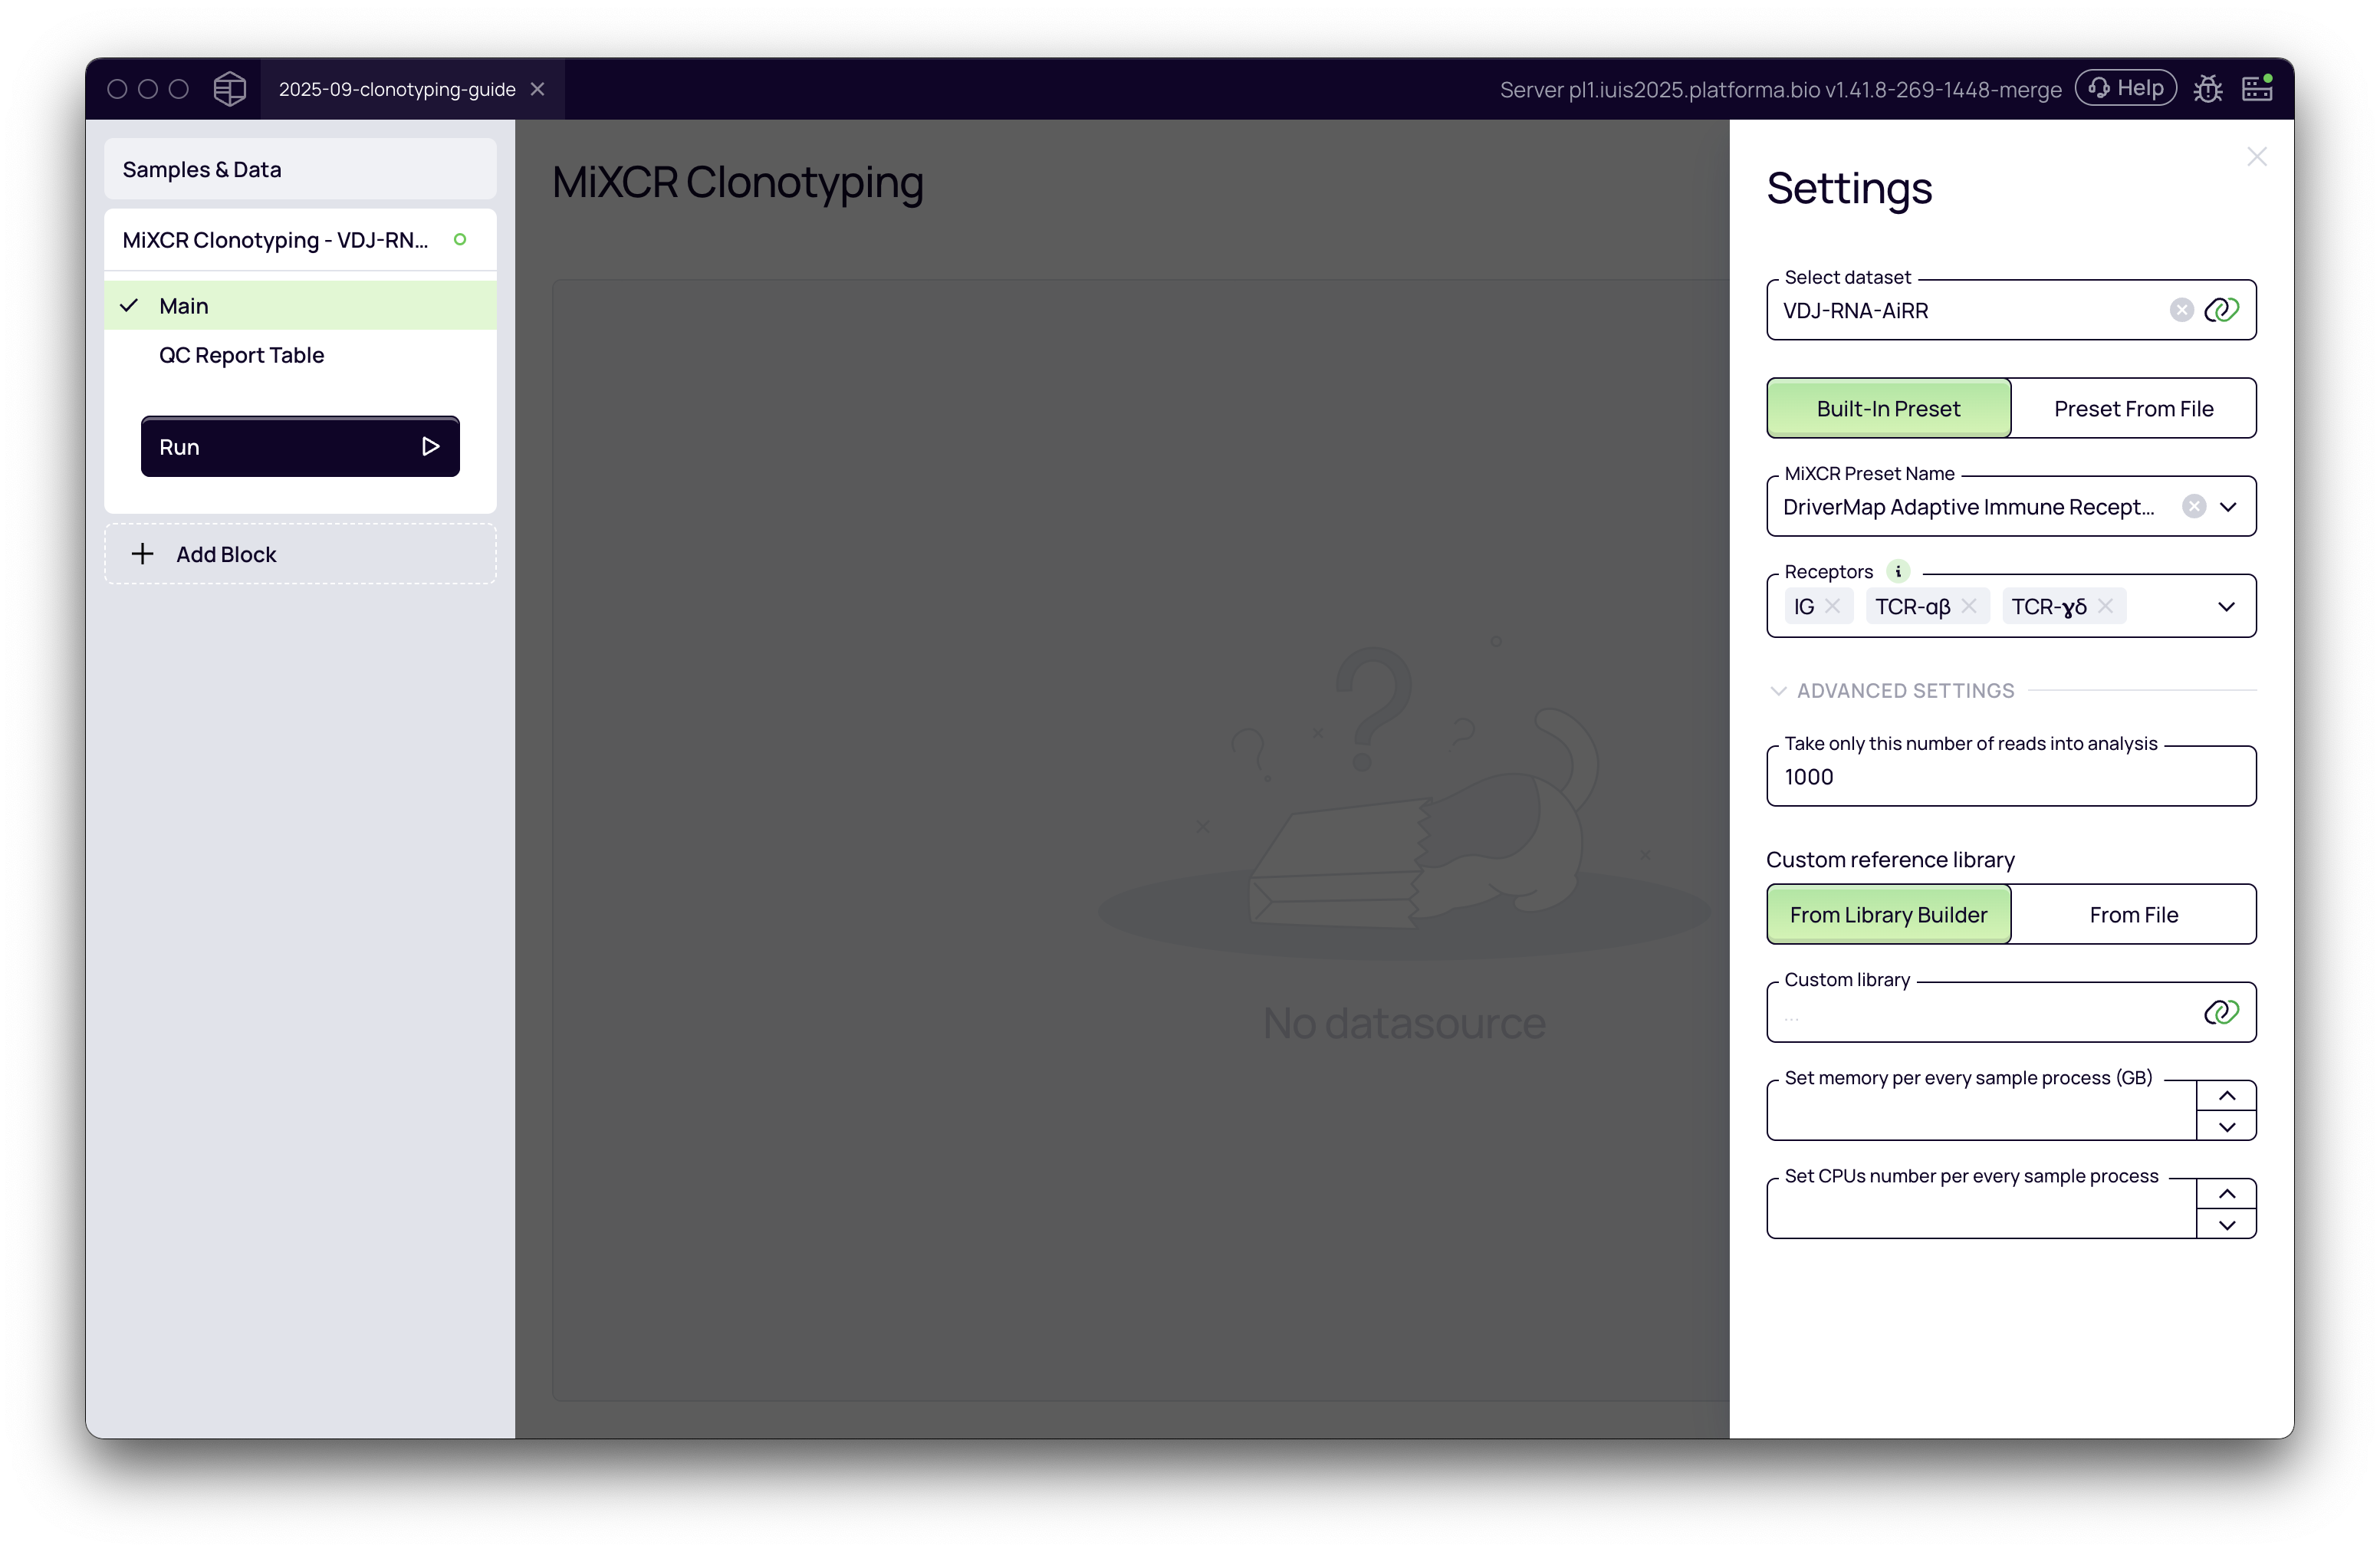
After adding the block, you will need to configure the analysis settings in the right-hand panel.
First, choose the dataset you want to analyze. In our example, we'll select the Bulk-RNA-AIRR dataset.
Choose a preset
There are two main options for presets:
- Built-in Preset: For sequencing libraries prepared with commercial kits (e.g., 10x Genomics 5' VDJ or Illumina AmpliSeq).
- Preset From File: For custom library preparation protocols.
If you used a commercial kit or a standard protocol like RNA-Seq, Exome-Seq, or Smart-Seq2, just start typing its name in the "MiXCR Preset Name" dropdown, and it will appear.
If you cannot find your kit or used a custom library preparation protocol, you can provide a YAML file for "Preset from File" with the specific parameters for your analysis. This offers greater flexibility for non-standard data. You can find detailed instructions on how to create these preset files in the MiXCR documentation (where you can also find links to all existing presets on GitHub to use as comprehensive examples). You can also ask for help on:
Once you choose the preset, you can click "Run" to start the analysis. However, we strongly recommend selecting the appropriate chains and running a "dry run" before the full execution.
Select immunological chains
It is very important to specify which immunological chains or receptors to analyze in the "Receptors" dropdown. Selecting the correct chains is crucial for focusing the analysis. Your library preparation likely targeted specific receptor chains (e.g., only TCR beta, or both IGH and IGK for B-cells). Selecting only the relevant chains makes the analysis faster and the results cleaner by preventing MiXCR from searching for chains that are not present in your data.
By default, all 7 chains are checked, but in most cases, you should select only the ones that were amplified in your library.
For bulk data, select the checkboxes for all the chains you want to include in the analysis: TCR-α, TCR-β, TCR-γ, TCR-δ, IG Heavy, or IG Light, or any combination of them.
When choosing a single-cell preset, you need to specify which receptors to include in the analysis: TCR-αβ, TCR-γδ, IG, or any combination of them.
Advanced settings
There are a couple of useful (and sometimes required) controls under "Advanced Settings".
Limit number of reads for analysis
For a quick "dry run" to validate your pipeline, you can limit the number of reads per sample (e.g., to 1,000 or 10,000) using the "Take only this number of reads into analysis" field. This allows the analysis to complete quickly, letting you check the downstream steps before launching the full analysis, which can be time-consuming.
Custom reference library
While MiXCR includes a comprehensive built-in gene library (which you can explore online at vdj.online/library), you can provide your own custom library from a file or by using the MiXCR Library Builder block within Platforma. This allows you to, for example:
- Use an IMGT library file (available here, subject to the https://imgt.org license)
- Create a library for model species like humanized mice
- Construct a library for a novel species from FASTA data
For a detailed guide on the MiXCR Library Builder, see:
Memory and CPU settings
Optionally, you can specify the amount of memory and the number of CPUs to allocate for each sample's analysis. This is particularly important when your backend is not using a batch system, as it allows you to run as many analyses in parallel as the machine's resources allow. For example, on a machine with 64GB of memory and 32 CPUs, setting 16GB of memory and 8 CPUs per process will allow 4 jobs to run in parallel.
The default values are 64GB for bulk data and range from 110GB to 192GB for single-cell data, with a default of 16 CPUs (you can find them in the source code of the block's workflow). The default memory may be too high for some data types (e.g., with a low number of clonotypes and no barcodes), while some datasets, especially those with a large number of barcodes, may require more memory than the default settings.
Setting the memory too low for your dataset may result in Out Of Memory (OOM) errors.
Now we have all the parameters set for the first run.
Running the analysis and interpreting results
Once your settings are configured, click the "Run" button. The main view will show the progress of the analysis for each sample. When the analysis is complete, you will see an overview of quality checks for all samples.
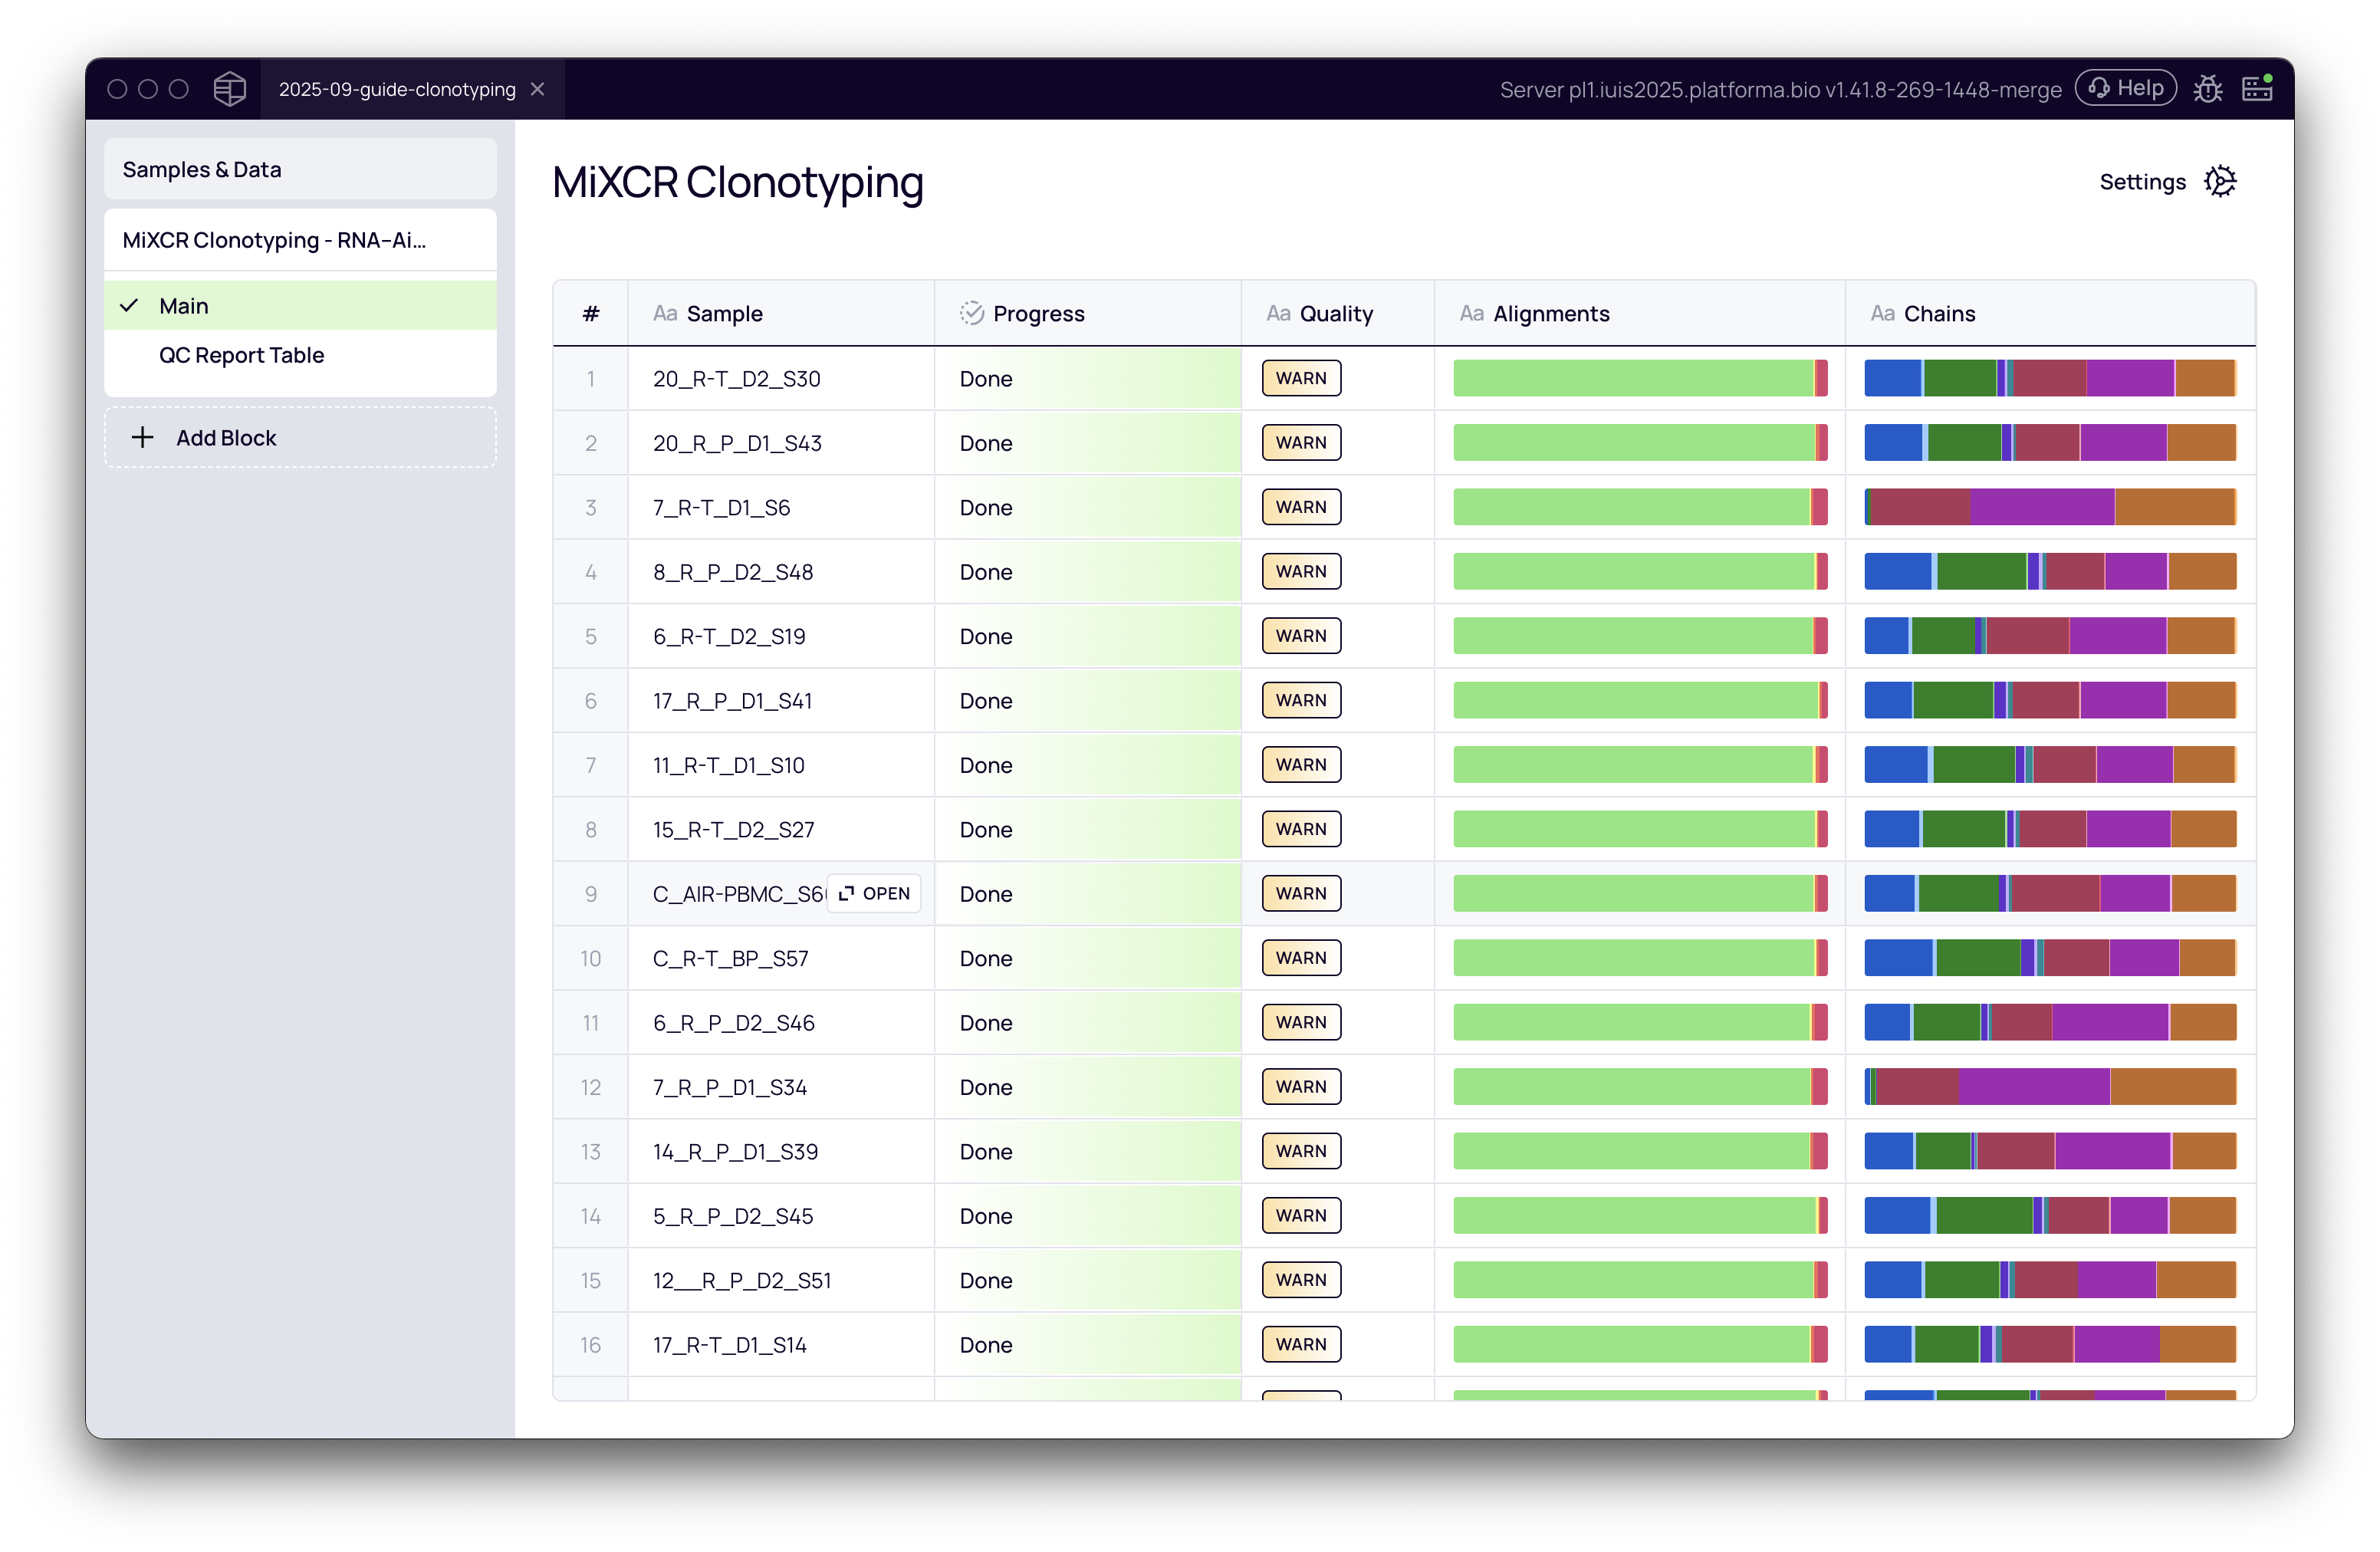
The overview of quality checks provides three main columns:
- Quality: A summary showing
WARNorALERTif there are any warnings or alerts in any of the QC checks. - Alignment: A stacked bar showing the proportion of successfully aligned vs. non-aligned reads.
- Chains: The proportion (in reads) of identified chains in the data.
Quality Control (QC) report
To dive deeper into the quality of an individual sample, you can click on it to view a detailed quality control (QC) report.
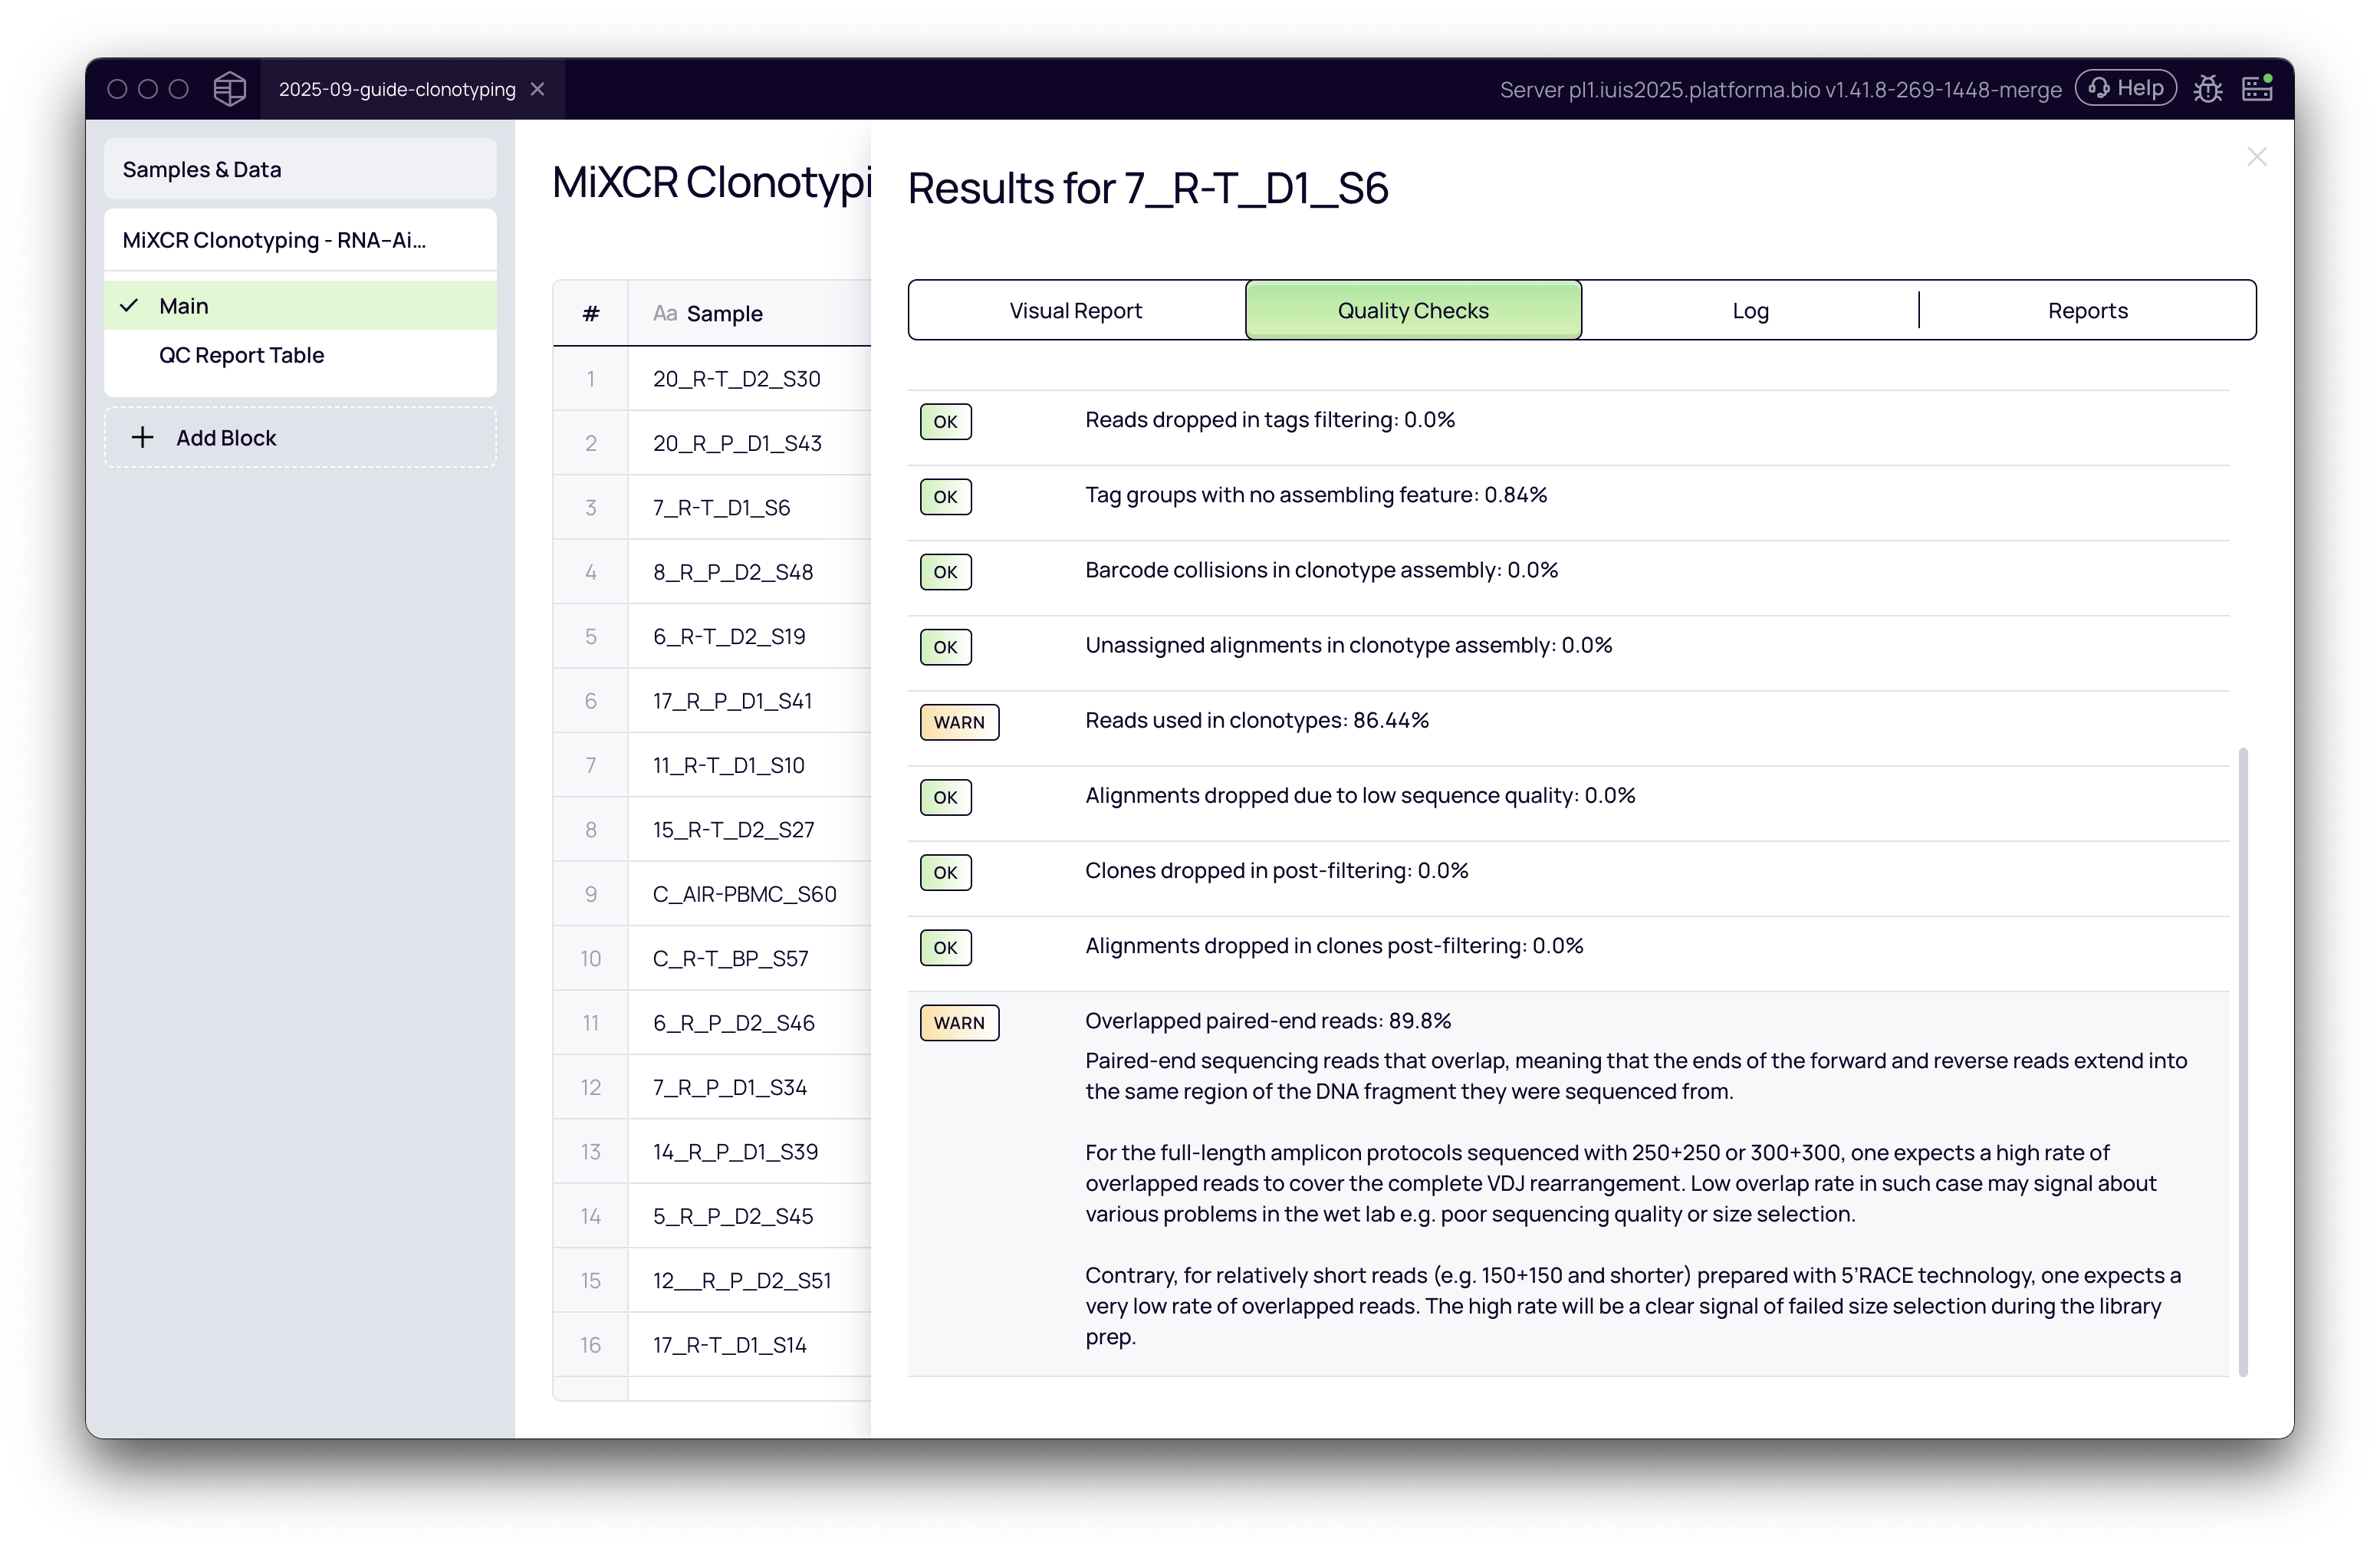
The QC report provides a wealth of information across several tabs:
-
Visual Report: This tab gives a high-level overview, including the proportion of successfully aligned reads and the distribution of reads across different chains. This is a good first place to check if the analysis ran as expected.
-
Quality Checks: This is a critical section. MiXCR performs a comprehensive list of checks and provides feedback on the quality of your library preparation. It will issue warnings or alerts for potential issues. Some key checks include:
- Initial reads: The total number of reads in the input file.
- Successfully aligned reads: The percentage of reads that were successfully aligned to V, D, J, and C genes. A high percentage is desirable. A low percentage may indicate issues with library preparation, the choice of preset, or the reference gene library.
- Reads used in clonotypes: The percentage of reads that were successfully assembled into clonotypes. For high-quality targeted sequencing libraries, this value is typically high (>70-80%). For non-targeted data like RNA-Seq, this value will be much lower. An unexpectedly low value may suggest problems.
- Final clonotype count: The total number of unique clonotypes identified in the sample.
For detailed explanations of each QC metric and potential causes for warnings or alerts, refer to the MiXCR documentation.
-
Log and Reports: These tabs provide the raw output from the MiXCR command-line tool, which can be useful for advanced troubleshooting.
Understanding the clonotyping output
The main output of the MiXCR Clonotyping block is a set of clonotype tables. These tables are the foundation for all downstream VDJ analysis in Platforma.
A separate table is generated for each immunological chain you selected for analysis. For example, if you analyzed TCR-α and TCR-β chains, the block will produce two distinct clonotype tables (and one in single cell case).
Each clonotype table contains a list of unique clonotypes and provides two main types of information for each one:
- Abundance: This tells you how prevalent each clonotype is in every sample. For bulk data, this is typically measured in read counts or UMI counts. For single-cell data, it's the number of cells in which the clonotype was found.
- Properties: These are the descriptive features of the clonotype, such as its CDR3 amino acid and nucleotide sequences, the best-matching V, D, and J genes, and the number of mutations.
This standardized, structured output is what allows other blocks, like those for diversity analysis or V/J gene usage, to seamlessly find and analyze the results of your clonotyping run.
Browsing clonotypes
Once the clonotyping run is complete, you can explore the resulting clonotype tables with the Clonotype Browser block.
- Add a "Clonotype Browser" block to your project.
- In the settings, select the receptor chain you want to investigate (e.g., TCR Beta). Because the clonotyping block generates a separate table for each chain, you are choosing which one to view here.
The Clonotype Browser has two main views:
- Per Sample: This view shows a table of all clonotypes found in a selected sample. You can customize the columns to display various metrics like UMI counts, CDR3 sequences, and V/D/J gene assignments.
- Overlap: This view aggregates clonotypes from all samples, allowing you to see which clonotypes are shared across multiple samples. You can sort by the "Number of Samples" column to easily identify public clonotypes.
This concludes the basic guide to clonotyping analysis in Platforma. From here, you can proceed with more advanced downstream analyses.
Next steps
With your data clonotyped, you are ready for downstream analysis. You can now use a variety of blocks to explore your repertoire.