Enrichment Analysis
In antibody discovery campaigns using display technologies (like phage, yeast, or ribosome display), the primary goal is to isolate high-affinity binders from a vast library through successive rounds of selection or "panning." The Clonotype Enrichment analysis block is a powerful tool designed to identify and quantify the antibody clonotypes (or clusters of similar clonotypes) that become more abundant throughout this selection process.
This analysis takes your sequenced libraries from each round, calculates how the frequency of each clonotype changes, and provides clear visualizations and metrics to pinpoint the most successfully enriched candidates.
Prerequisites
Before starting, ensure you have the following set up in your project:
- Sequencing Data: Samples from each round of your selection experiment have been imported and processed with a clonotyping block.
- Metadata: You must have a metadata column that clearly defines the selection round for each sample. For example, a column named
enrichmentRoundwith values likeR0,R1, andR2representing round 0, round 1, and round 2. - (Optional but Recommended): You have run the Clonotype Clustering block to group similar antibody sequences. Enrichment analysis can be performed on these clusters for a more robust biological interpretation.
Adding and Configuring the Block
First, add the Clonotype Enrichment block to your pipeline.
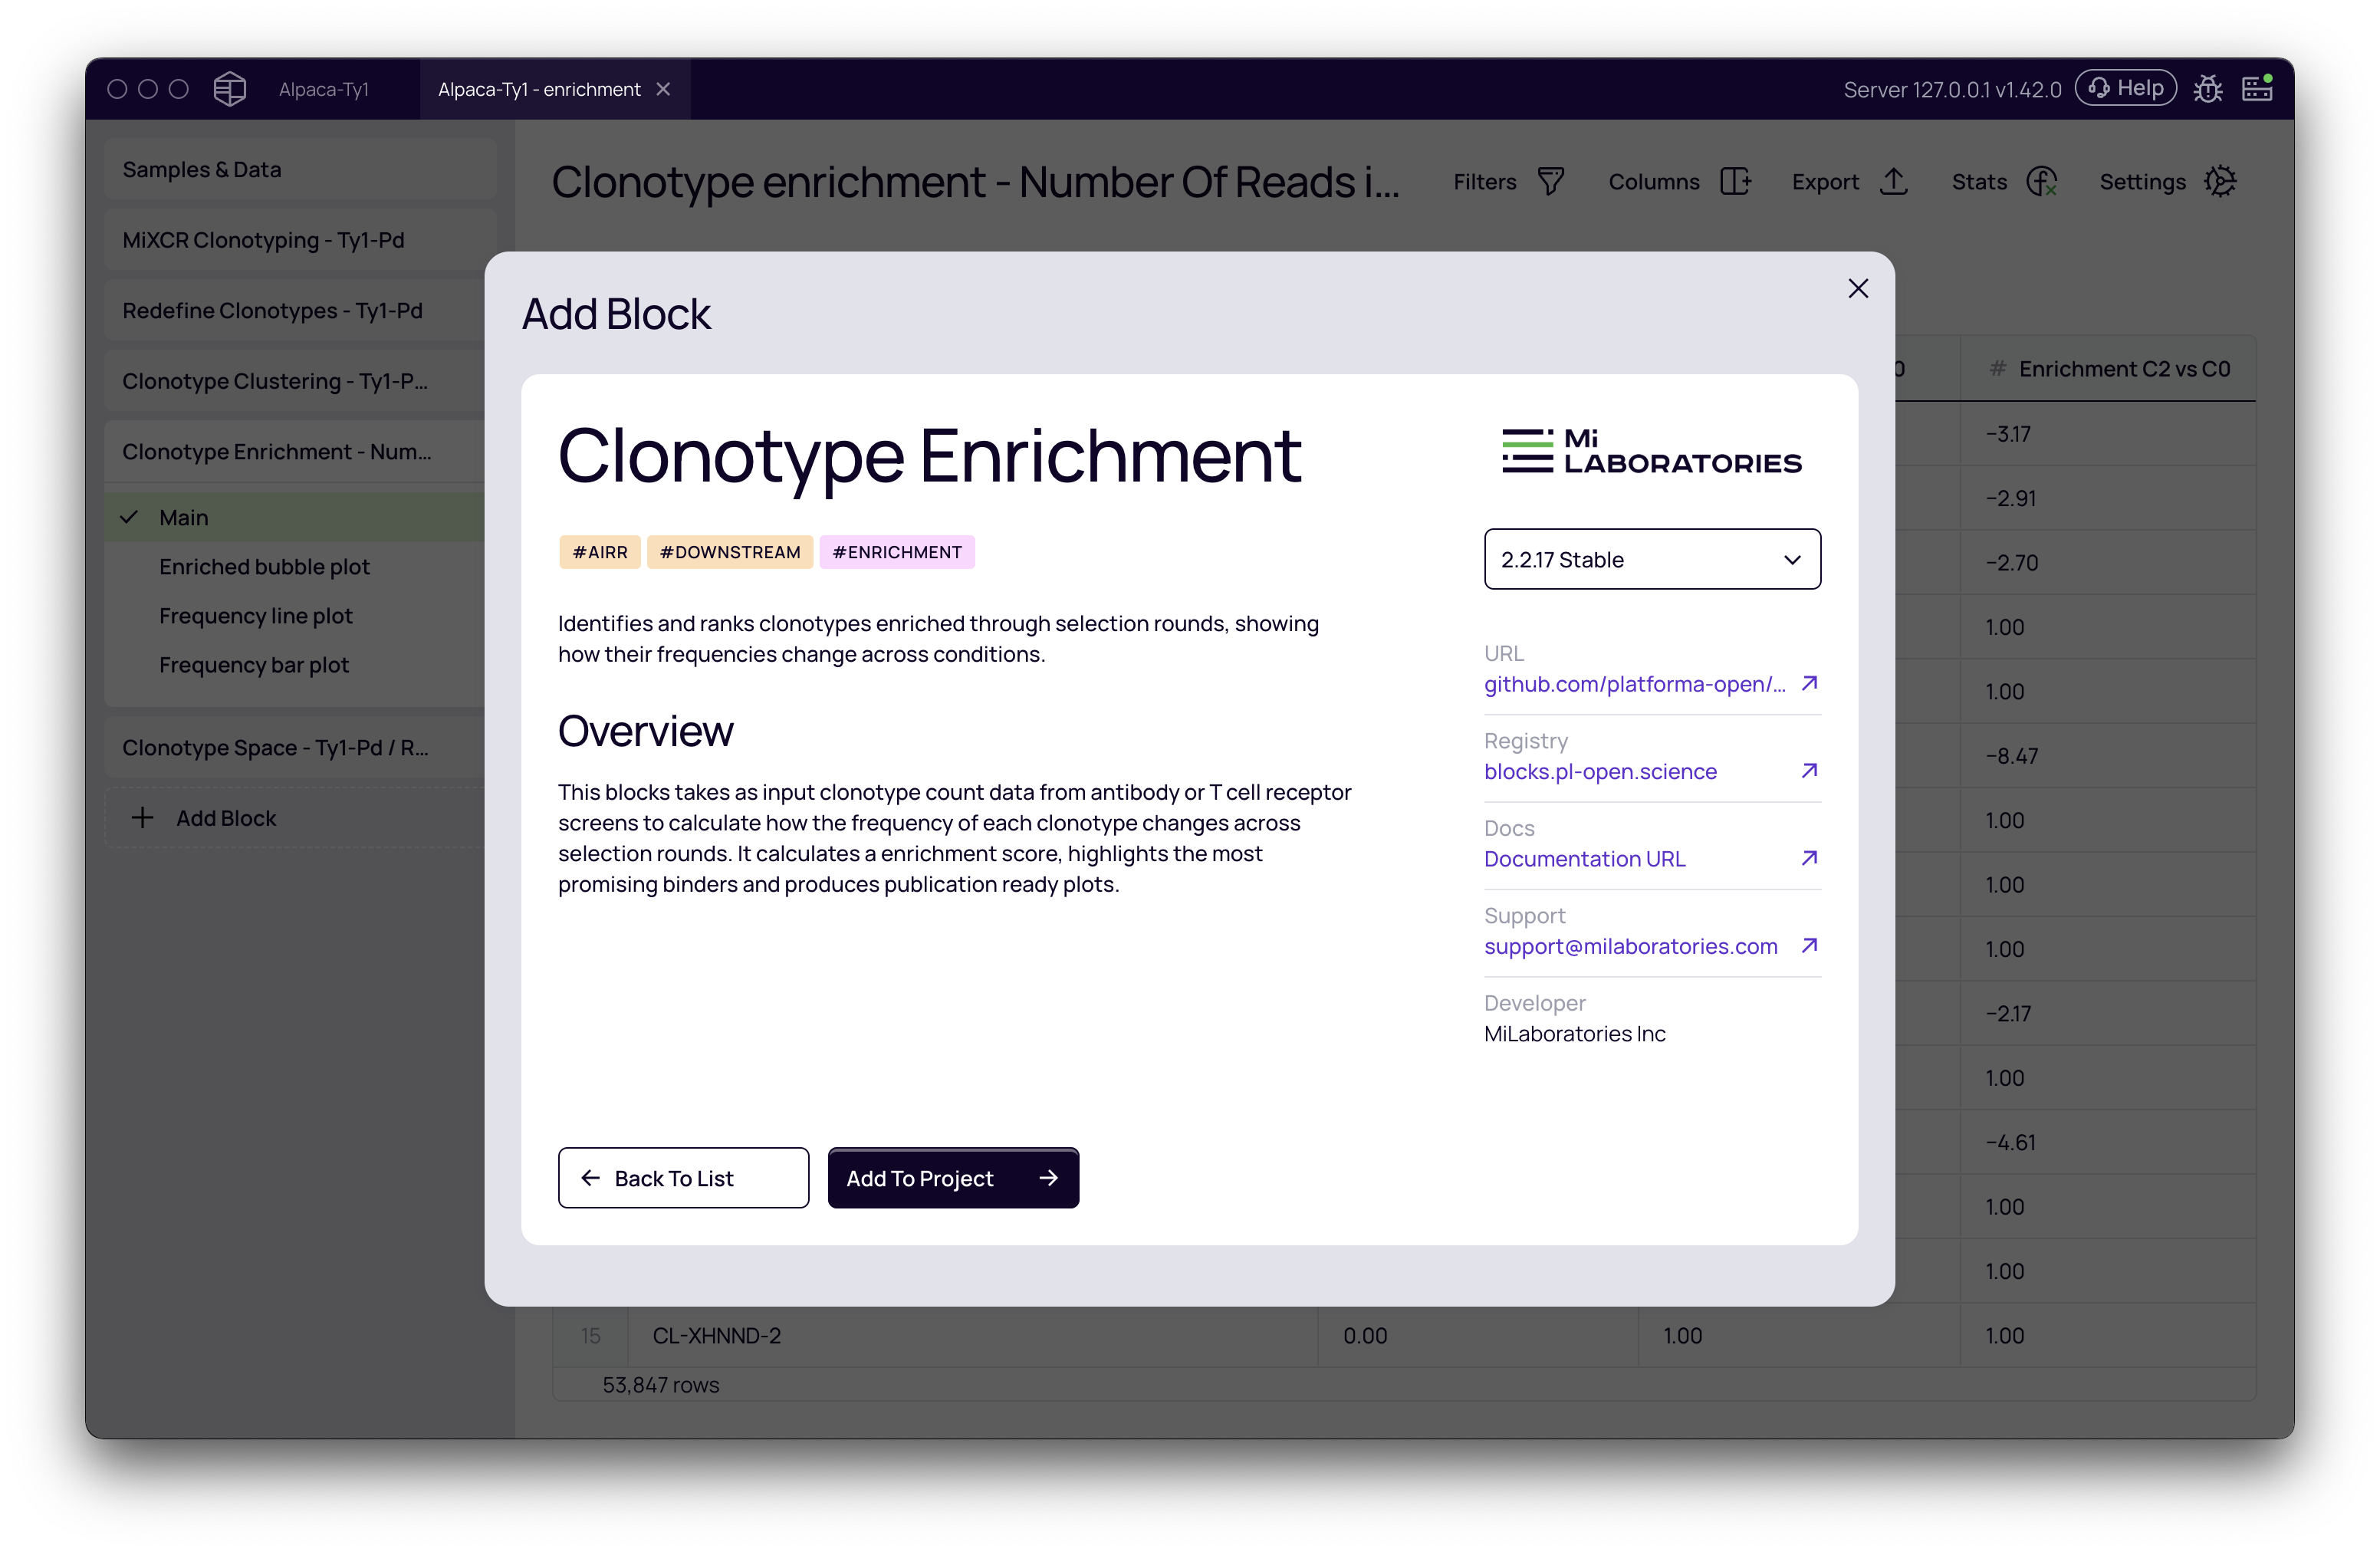
Once the block is added, click on it to open the settings panel on the right. Here, you'll define the parameters for the analysis.
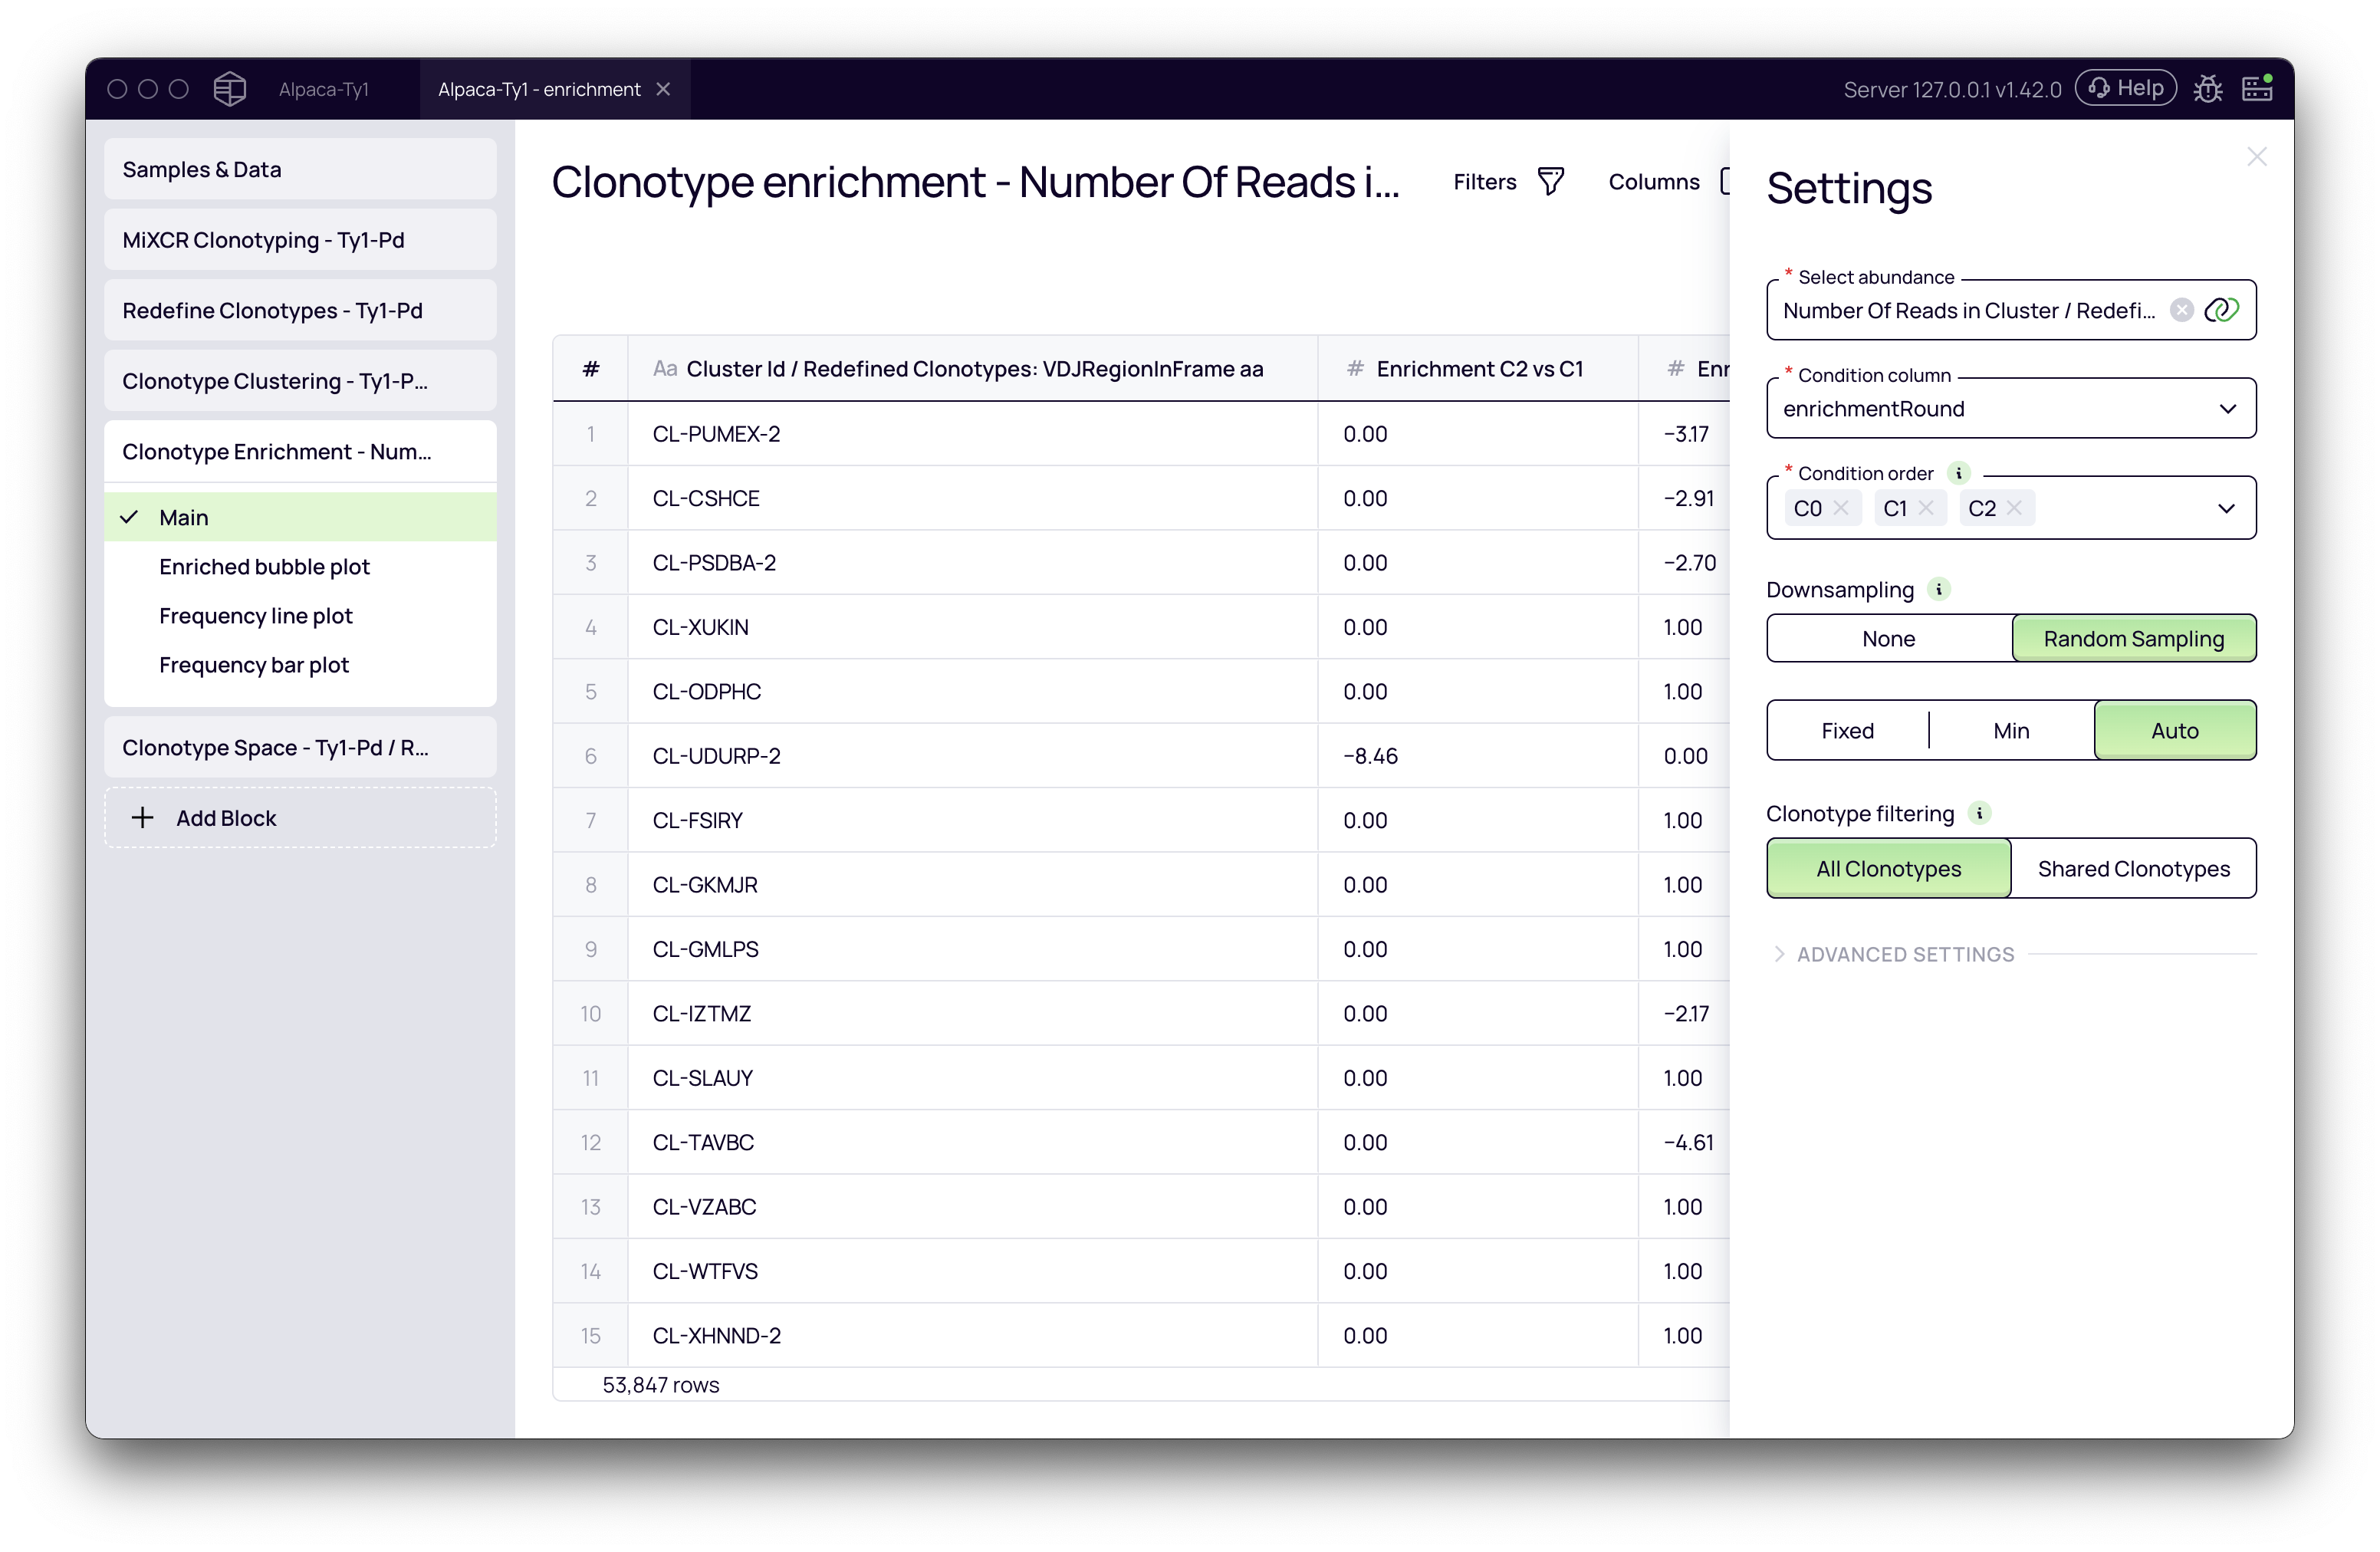
Key Parameters
- Select abundance: This is the metric used to measure the frequency of each clonotype/cluster.
- To analyze individual clonotypes, choose an option like
Number Of Reads. - To analyze clusters of similar antibodies (recommended), choose
Number Of Reads in Cluster, which becomes available after running the Clonotype Clustering block. This is a key feature, as it leverages upstream analysis results.
- To analyze individual clonotypes, choose an option like
- Condition column: Select the metadata column that specifies the selection round (e.g.,
enrichmentRound). - Condition order: It is crucial to set the correct chronological order of your selection rounds. Drag and drop the values to reflect the progression of your experiment (e.g.,
R0⟶R1⟶R2). - Downsampling: This parameter normalizes your data to account for differences in sequencing depth between samples.
- None: No normalization is applied.
- Random sampling: The recommended setting. It will down-sample all conditions to a uniform read count, ensuring a fair comparison. The
Automode automatically determines the best count for down-sampling.
- Clonotype filtering: This defines which clonotypes are included in the analysis.
- All Clonotypes (default): Includes all clonotypes/clusters. A cluster that appears for the first time in a later round will still be analyzed and reported as enriched.
- Shared Clonotypes: Restricts the analysis to only those clonotypes/clusters that are present in at least two of the specified conditions. This can help reduce noise from clonotypes that appear sporadically in a single round.
Once configured, click the Run button.
Interpreting the Results
The block generates several outputs to help you understand the enrichment patterns.
Enrichment Table and Statistics
The main view is a table listing your clonotypes or clusters and their calculated enrichment scores. The enrichment score is a log₂ fold change in abundance between two conditions (e.g., Enrichment R2 vs R0). A positive score indicates enrichment; for example, a score of 1.0 means a 2-fold increase in abundance, and a score of 2.0 means a 4-fold increase.
Click the Stats button at the top to view a summary, including the maximum, minimum, and median enrichment scores across your entire dataset. This view also shows the default Enrichment score cutoff (typically 1.0) used to define an "enriched" clonotype in downstream blocks.
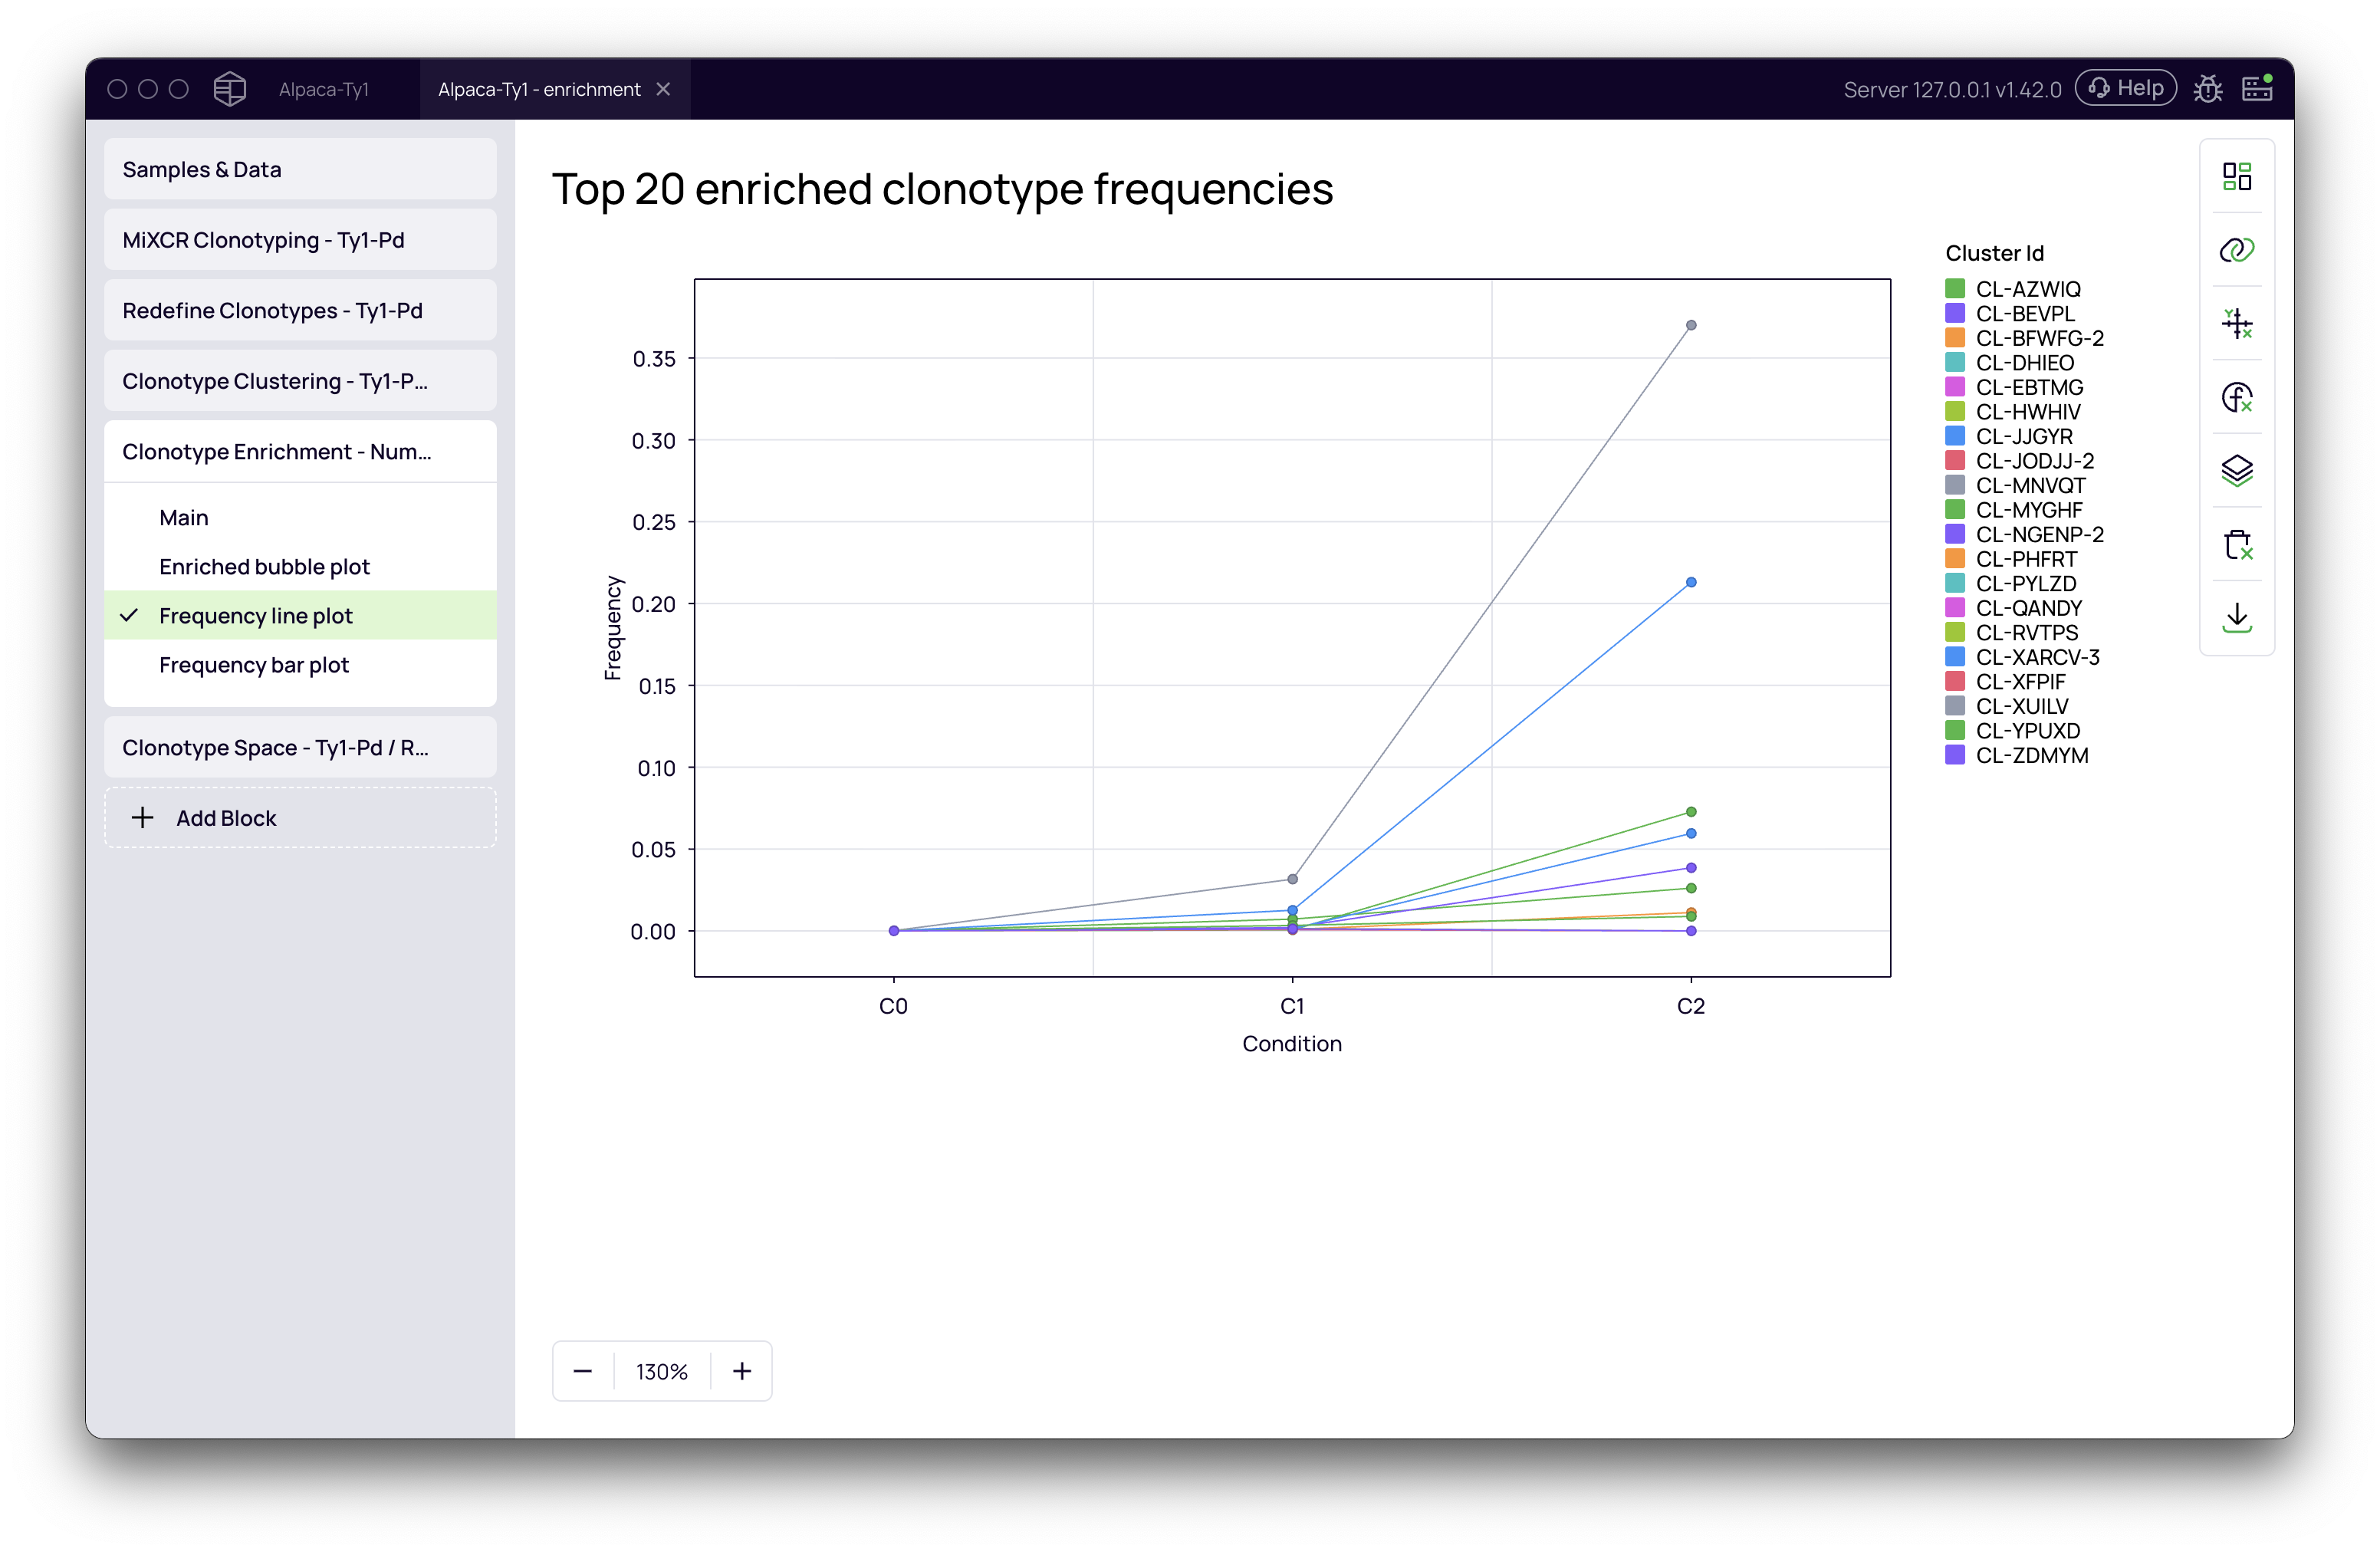
Visualizations
- Frequency line plot: This is the most intuitive visualization. It displays the change in frequency for the top enriched clusters across all selection rounds. You can easily spot which candidates show a consistent increase in abundance, which is a strong indicator of successful selection.
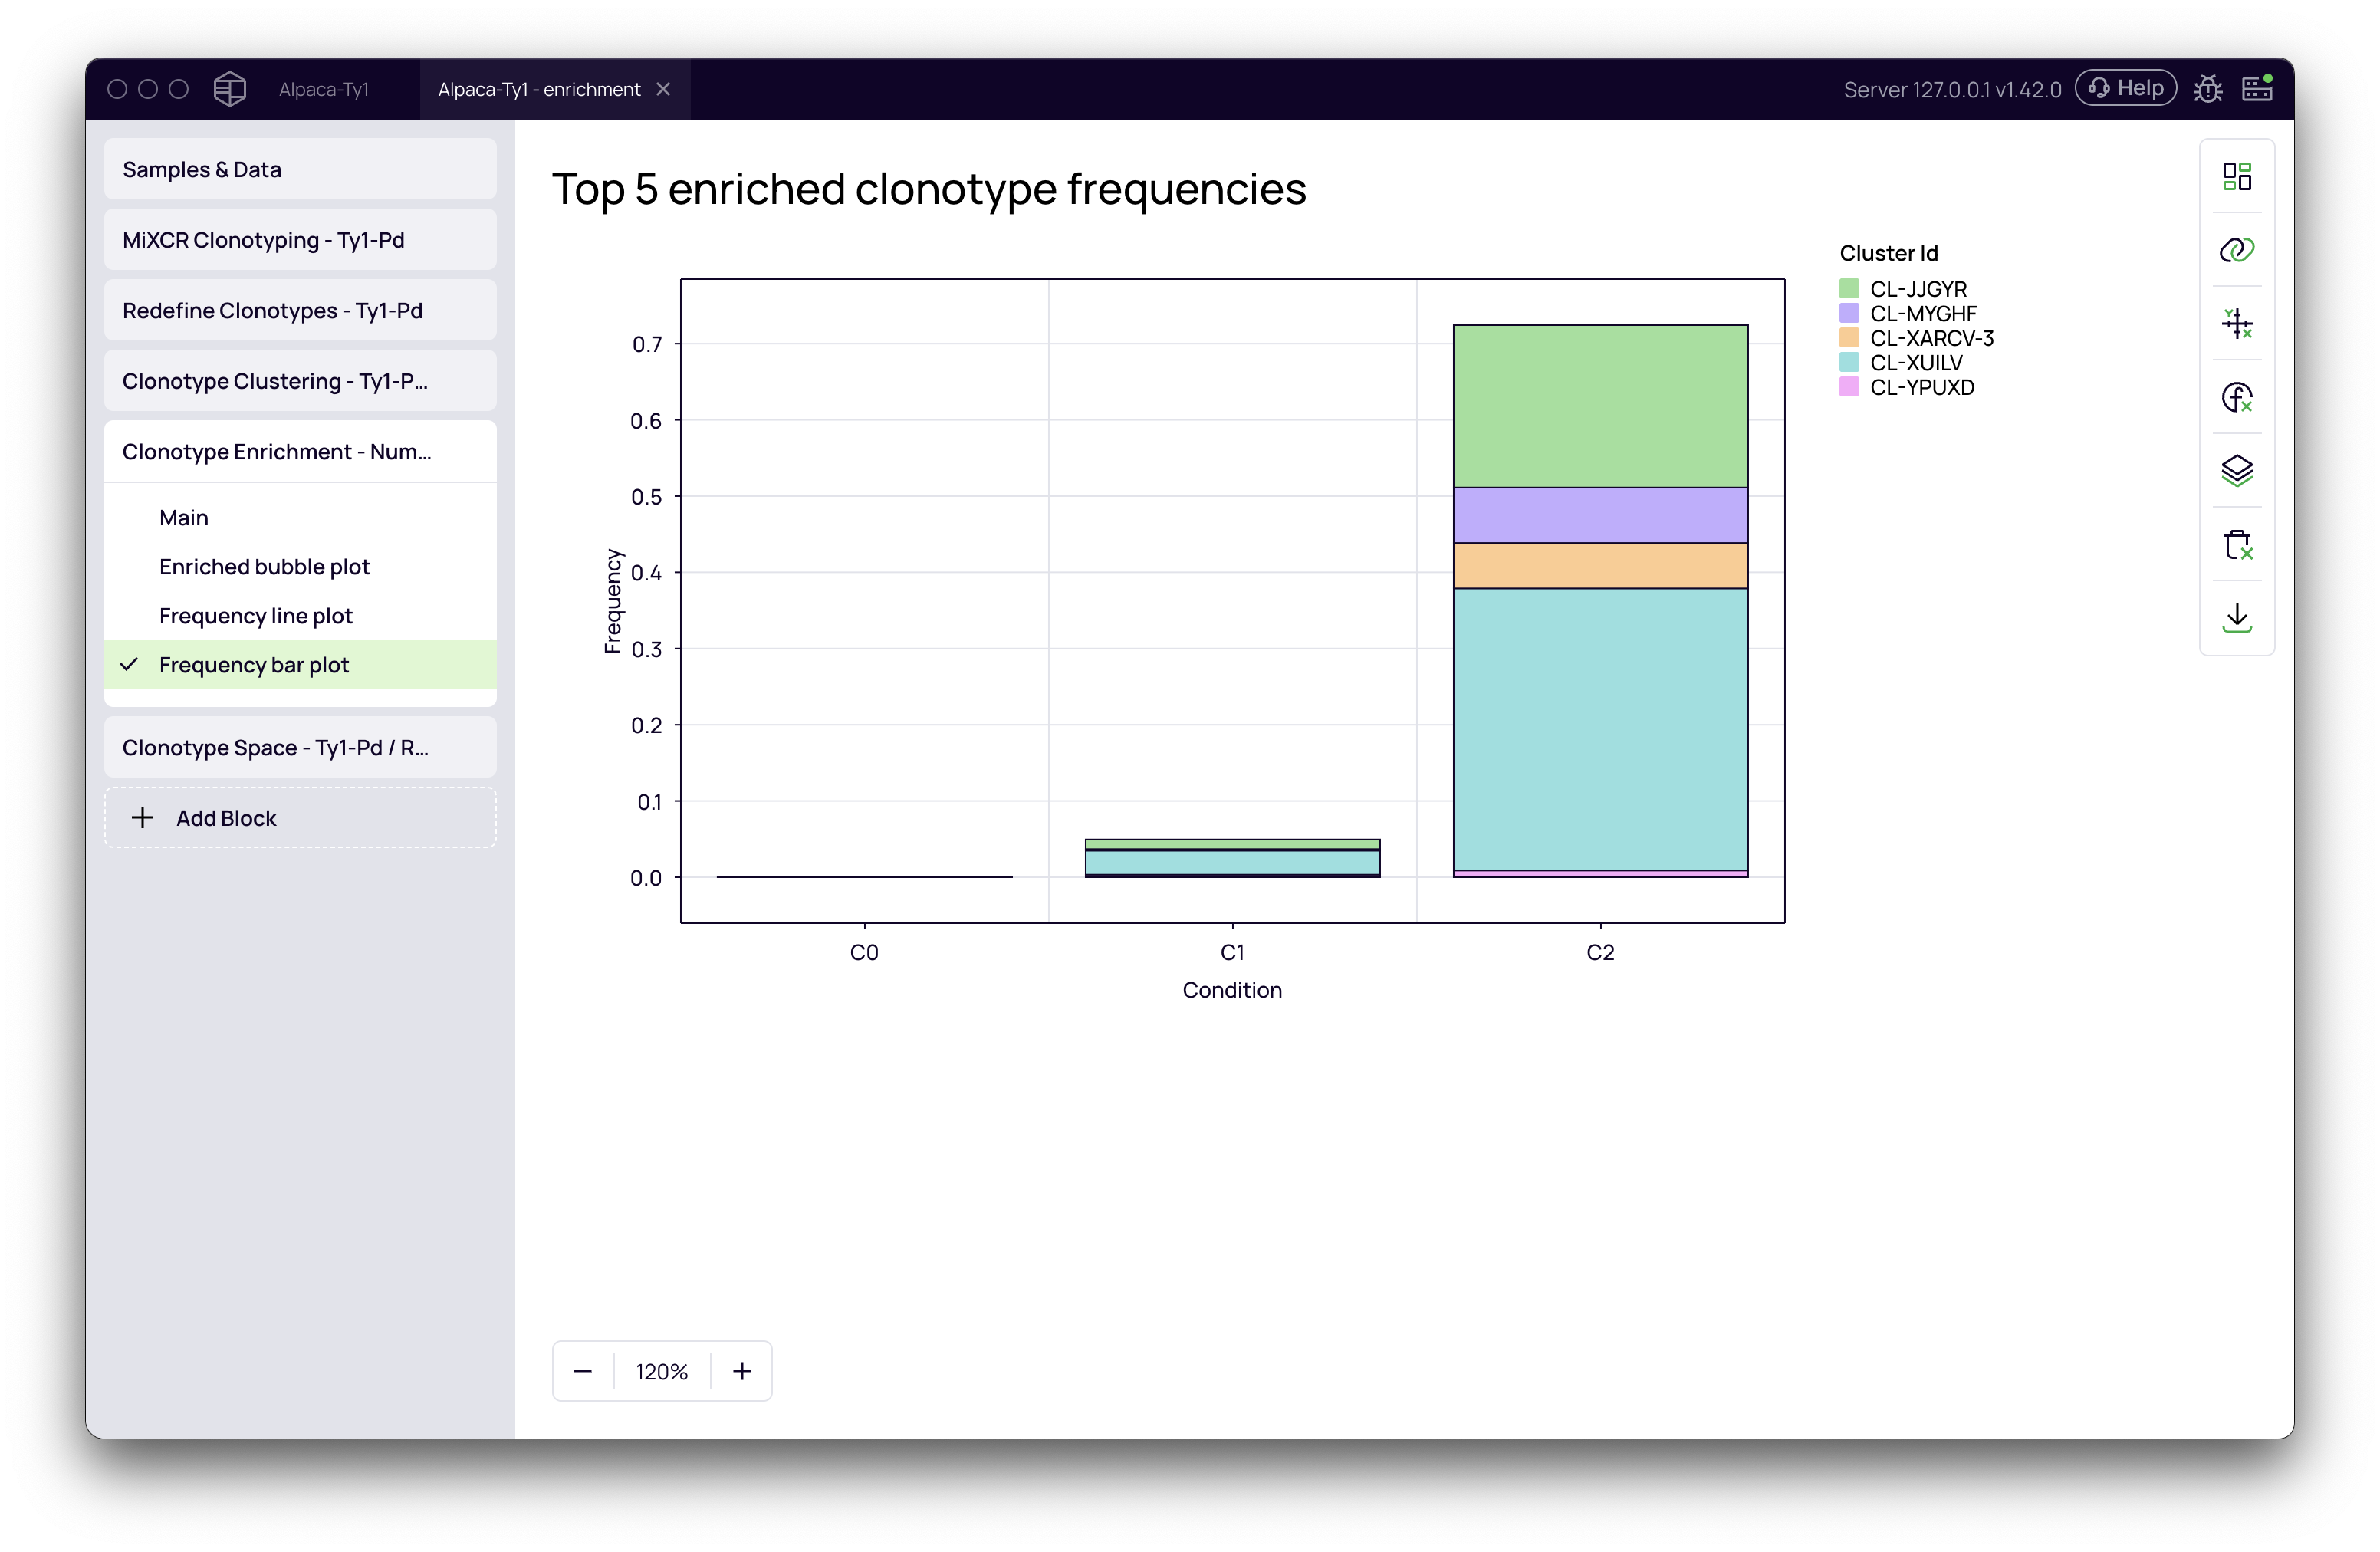
- Frequency bar plot: A bar chart view of the abundance of the top enriched clusters in each condition.
- Enriched bubble plot: This plot visualizes the relationship between a cluster's enrichment score (y-axis) and its frequency in the baseline condition (x-axis), with a bubble size representing frequency in the comparison condition. It helps to quickly identify highly enriched clones that were rare in the initial library.
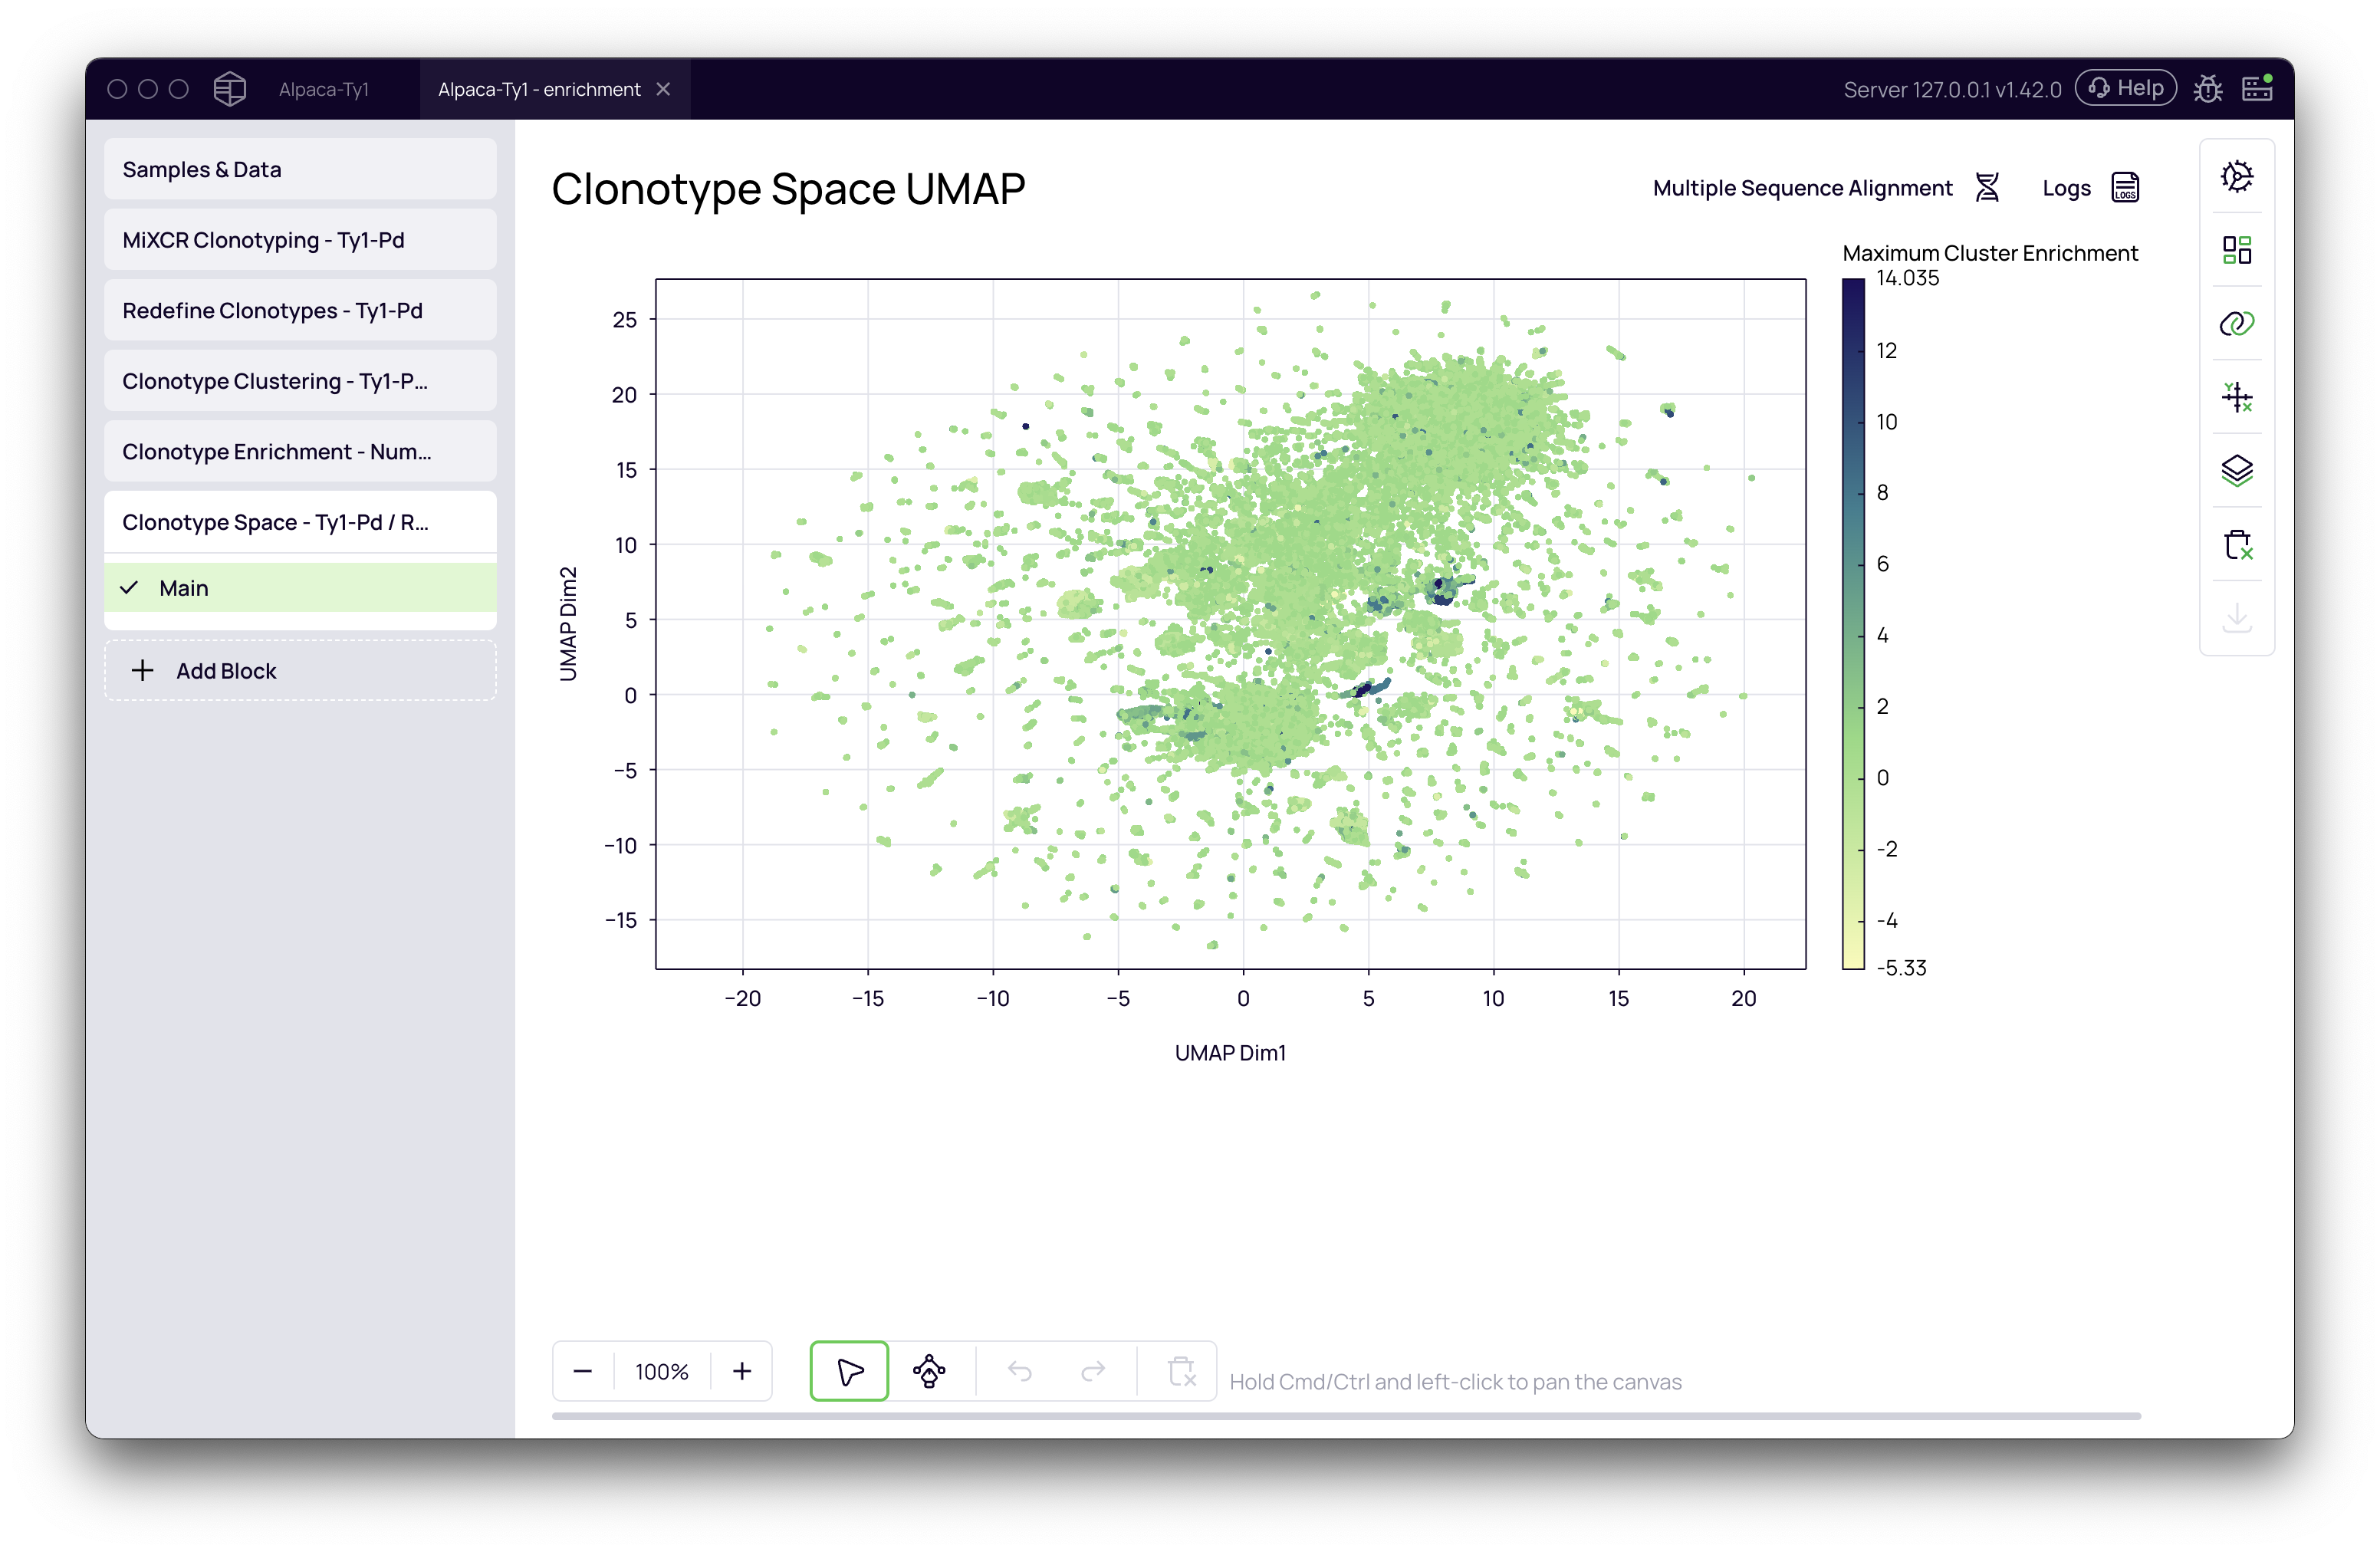
Example of Downstream Analysis: Visualizing in Clonotype Space
The enrichment scores calculated by this block can be used to visualize and select candidates in other parts of the platform. For example, you can visualize the enriched clusters on a UMAP plot, connecting the enrichment data back to the antibody sequences themselves.
To do this:
- Add a Clonotype Space block after the enrichment analysis.
- Run the block to generate a UMAP projection of your antibodies.
- In the Chart variables panel on the right, go to the Highlight / Color section.
- Select the Maximum Enrichment metric from the dropdown.
The UMAP plot will now be colored by enrichment score, instantly revealing the regions of the clonotype space that contain your most promising enriched candidates. You can then use the selection tools to isolate these clusters for further investigation, such as multiple sequence alignment or export for synthesis and validation.